NASA GHRC Collaboration between NASA MSFC and The University of Alabama in Huntsville
  • Access Data
    • Dataset List (HyDRO)
      • View a list of all GHRC dataset holdings using our custom search tool, HyDRO.
    • Search (HyDRO)
      • HyDRO is GHRC's custom dataset search and order tool.

        With HyDRO, you can search, discover, and filter GHRC's dataset holdings.

        HyDRO will also help you find information about browse imagery, access restrictions, and dataset guide documents.
    • NASA Earthdata Search
      • Earthdata is NASA's next generation metadata and service discovery tool, providing search and access capabilities for dataset holdings at all of the Distributed Active Archive Centers (DAACs) including the GHRC.
    • Latest Data (HyDRO)
      • View the latest additions to our data holdings using HyDRO.
  • Measurements
  • Field Campaigns
    • Hurricane Science
      • GHRC has worked with NASA's Hurricane Science Research Program (HSRP) since the 1990's. We are the archive and distribution center for data collected during HSRP field campaigns, as well as the recent Hurricane Science and Severe Storm Sentinel (HS3) Earth Venture mission. Field campaigns provide for intensive observation of specific phenomena using a variety of instruments on aircraft, satellites and surface networks.

        GHRC also hosts a database of Atlantic and Pacific tropical storm tracks derived from the storm data published by the National Hurricane Center (NHC).
    • HS3 (2012-14)
      • Hurricane and Severe Storm Sentinel (HS3) is an Earth Ventures – Suborbital 1 mission aimed at better understanding the physical processes that control hurricane intensity change, addressing questions related to the roles of environmental conditions and internal storm structures to storm intensification.

        A variety of in-situ, satellite observations, airborne data, meteorological analyses, and simulation data were collected with missions over the Atlantic in August and September of three observation years (2012, 2013, 2014). These data are available at GHRC beginning in 2015.
    • GRIP (2010)
      • The Genesis and Rapid Intensification Processes (GRIP) experiment was a NASA Earth science field experiment in 2010 that was conducted to better understand how tropical storms form and develop into major hurricanes.

        The GRIP deployment was 15 August – 30 September 2010 with bases in Ft. Lauderdale, FL for the DC-8, at Houston, TX for the WB-57, and at NASA Dryden Flight Research Facility, CA for the Global Hawk.
    • TC4 (2007)
      • The NASA TC4 (Tropical Composition, Cloud and Climate Coupling) mission investigated the structure and properties of the chemical, dynamic, and physical processes in atmosphere of the tropical Eastern Pacific.

        TC4 was based in San Jose, Costa Rica during July 2007.

        The Real Time Mission Monitor provided simultaneous aircraft status for three aircraft during the TC4 experiment. During TC4, the NASA ER-2, WB-57 and DC-8 aircraft flew missions at various times. The science flights were scheduled between 17 July and 8 August 2007.
    • NAMMA (2006)
      • The NASA African Monsoon Multidisciplinary Analyses (NAMMA) campaign was a field research investigation based in the Cape Verde Islands, 350 miles off the coast of Senegal in west Africa.

        Commenced in August 2006, NASA scientists employed surface observation networks and aircraft to characterize the evolution and structure of African Easterly Waves (AEWs) and Mesoscale Convective Systems over continental western Africa, and their associated impacts on regional water and energy budgets.
    • TCSP (2005)
      • The Tropical Cloud Systems and Processes (TCSP) mission was an Earth science field research investigation focused on the study of the dynamics and thermodynamics of precipitating cloud systems and tropical cyclones. TCSP was conducted during the period July 1-27, 2005 out of the Juan Santamaria Airfield in San Jose, Costa Rica.

        The TCSP field experiment flew 12 NASA ER-2 science flights, including missions to Hurricanes Dennis and Emily, Tropical Storm Gert and an eastern Pacific mesoscale complex that may possibly have further developed into Tropical Storm Eugene.
    • ACES (2002)
      • The Altus Cumulus Electrification Study (ACES) was aimed at better understanding the causes and effects of electrical storms.

        Based at the Naval Air Station Key West in Florida, researchers in August 2002 chased down thunderstorms using an uninhabited aerial vehicle, or "UAV", allowing them to achieve dual goals of gathering weather data safely and testing new aircraft technology. This marked the first time a UAV was used to conduct lightning research.
    • CAMEX-4 (2001)
      • The Convection And Moisture EXperiment (CAMEX) was a series of NASA-sponsored hurricane science field research investigations. The fourth field campaign in the CAMEX series (CAMEX-4) was held in 16 August - 24 September, 2001 and was based out of Jacksonville Naval Air Station, Florida.

        CAMEX-4 was focused on the study of tropical cyclone (hurricane) development, tracking, intensification, and landfalling impacts using NASA-funded aircraft and surface remote sensing instrumentation.
    • CAMEX-3 (1998)
      • The Convection And Moisture EXperiment (CAMEX) is a series of hurricane science field research investigations sponsored by NASA. The third field campaign in the CAMEX series (CAMEX-3) was based at Patrick Air Force Base, Florida from 6 August - 23 September, 1998.

        CAMEX-3 successfully studied Hurricanes Bonnie, Danielle, Earl and Georges, yielding data on hurricane structure, dynamics, and motion. CAMEX-3 collected data for research in tropical cyclone development, tracking, intensification, and landfalling impacts using NASA-funded aircraft and surface remote sensing instrumentation.
    • GPM Ground Validation
      • The NASA Global Precipitation Measurement Mission (GPM) Ground Validation (GV) program includes the following field campaigns:

        a) LPVEx, Gulf of Finland in autumn 2010, to study rainfall in high latitude environments

        b) MC3E, cental Oklahoma spring and early summer 2011, to develop a complete characterization of convective cloud systems, precipitation and the environment

        c) GCPEx, Ontario, Canada winter of 2011-2012, direct and remove sensing observations, and coordinated model simulations of precipitating snow.

        d) IFloodS, Iowa, spring and early summer 2013, to study the relative roles of rainfall quantities and other factors in flood genesis.

        e) IPHEx, N. Carolina Appalachians/Piedmont region May-June 2014, for hydrologic validation over varied topography.

        f) OLYMPEx, Washington's Olympic Peninsula scheduled November 2015-February 2016, for hydrologic validation in extreme coastal and topographic gradients
    • OLYMPEX (Upcoming)
      • The OLYMPEX field campaign is scheduled to take place between November, 2015, and February, 2016, on the Olympic Peninsula in the Pacific Northwest of the United States.

        This field campaign will provide ground-based validation support of the Global Precipitation Measurement (GPM) satellite program that is a joint effort between NASA and JAXA.

        As for all GPM-GV campaigns, the GHRC will provide a collaboration portal to help investigators exchange planning information and to support collection of real-time data as well as mission science, project and instrument status reports during the campaign.
    • IPHEx (2014)
      • The Integrated Precipitation and Hydrology Experiment (IPHEx) was conducted in North Carolina during the months of April-June, 2014.

        IPHEx sought to characterize warm season orographic precipitation regimes, and the relationship between precipitation regimes and hydrologic processes in regions of complex terrain.
    • IFLOODs (2013)
      • The Iowa Flood Studies (IFloodS) experiment was conducted in the central to northeastern part of Iowa in Midwestern United States during the months of April-June, 2013.

        IFloodS' primary goal was to discern the relative roles of rainfall quantities such as rate and accumulation as compared to other factors (e.g. transport of water in the drainage network) in flood genesis.
    • GCPEX (2011-2012)
      • The GPM Cold-season Precipitation Experiment (GCPEx) occurred in Ontario, Canada during the winter season (Jan 15- Feb 26) of 2011-2012.

        GCPEx addressed shortcomings in GPM snowfall retrieval algorithm by collecting microphysical properties, associated remote sensing observations, and coordinated model simulations of precipitating snow. Collectively the GCPEx data set provides a high quality, physically-consistent and coherent data set suited to the development and testing of GPM snowfall retrieval algorithm physics.
    • MC3E (2011)
      • The Mid-latitude Continental Convective Clouds Experiment (MC3E) took place in central Oklahoma during the April–June 2011 period.

        The overarching goal was to provide the most complete characterization of convective cloud systems, precipitation, and the environment that has ever been obtained, providing constraints for model cumulus parameterizations and space-based rainfall retrieval algorithms over land that had never before been available.
    • LPVEx (2010)
      • The Light Precipitation Evaluation Experiment (LPVEx) took place in the Gulf of Finland in September and October, 2010 and collected microphysical properties, associated remote sensing observations, and coordinated model simulations of high latitude precipitation systems to drive the evaluation and development of precipitation algorithms for current and future satellite platforms.

        In doing so, LPVEx sought to address the general lack of dedicated ground-validation datasets from the ongoing development of new or improved algorithms for detecting and quantifying high latitude rainfall
  • Projects
    • HS3 Suborbital Mission
      • Hurricane and Severe Storm Sentinel (HS3) is an Earth Ventures – Suborbital 1 mission aimed at better understanding the physical processes that control hurricane intensity change, addressing questions related to the roles of environmental conditions and internal storm structures to storm intensification.
    • DISCOVER - MEaSUREs
      • DISCOVER was funded by NASA’s MEaSUREs program to provide highly accurate, multi-decadal geophysical products derived from satellite microwave sensors.
    • LIS Mission
      • Lightning observations from the Lightning Imaging Sensors (LIS) aboard the NASA’s TRMM satellite and International Space Station, as well as airborne observations and ground validation data.
    • SANDS
      • The SANDS project addressed Gulf of Mexico Alliance priority issues by generating enhanced imagery from MODIS and Landsat data to identify suspended sediment resulting from tropical cyclones. These tropical cyclones have significantly altered normal coastal processes and characteristics in the Gulf region through sediment disturbance.
    • LANCE AMSR2
      • The Land, Atmosphere Near real-time Capability for EOS (LANCE) system provides access to near real-time data (less than 3 hours from observation) from AIRS, AMSR2, MLS, MODIS, and OMI instruments. LANCE AMSR2 products are generated by the AMSR Science Investigator-led Processing System at the GHRC.
  • Resources
    • Tools & Technologies
      • A collection of tools & technologies developed and/or used by GHRC.
    • Publications
      • View GHRC & ITSC publications on the ITSC website
    • Innovations Lab
      • The GHRC Innovations Lab is a showcase for emerging geoinformatics technologies resulting from NASA-sponsored research at the University of Alabama in Huntsville.
    • Educational Resources
      • A list of resources from NASA, MSFC, and other sources for teachers and students focused on global change, hydrology, and science education.
    • Referencing our data
      • GHRC dataset citation help and examples.
    • Documents
      • Documentation related to GHRC datasets, software, and other offerings.
    • Glossary
      • Terms and their definitions
    • Featured items
      • The latest tools from GHRC.
  • Multimedia
  • About
    • Welcome
      • Local resources, lodging information, and weather to help you plan your visit to GHRC.
    • GHRC Personnel
      • A list to help you keep in touch with our personnel
    • FAQ
      • Frequently Asked Questions about GHRC data and services, and their answers.
    • Data Citations and Acknowledgements
      • GHRC dataset citation help and examples
  • Cite Us
  • Contact Us
feedback
DOCUMENTATION

Documentation

Guide Documents

Dataset PI Documents

Dataset Software

CAMEX-3 Scanning Raman Lidar (SRL)

Table of Contents

Introduction
Theory of Operation
System Description
File Naming Convention
Data Format
Contact Information  

trailer with anvill cloudIntroduction

The Scanning Raman Lidar (Light Detection and Ranging) is an instrument designed to determine the composition and vertical distribution of several atmospheric constituents, specifically water vapor and aerosols. SRL is generally used as an atmospheric profiler, where the lidar is aimed upwards returning a vertical cross-section of the atmosphere.

The SRL was located on Andros Island during the CAMEX3 campaign, and operated nearly every night (exceptions noted) throughout the period 6 Aug-20 Sep 98.

Theory of Operation

Scattering: Anyone who has driven at night in the fog has experienced firsthand the effect that particles have in scattering a light source. In this case, the source is the headlight, and the particles are the water droplets making up the fog. As the light hits the fog, it reflects and bounces off in all directions, but some is redirected back at the driver. Because the droplets in this example are very large with respect to the wavelength of light, the cause for the scattering is due to the optical geometry of the droplets, that is , the droplets act as little lenses actually reflecting the light. Another type of scattering is called Rayleigh scattering, and it's cause is due to an interaction of the electromagnetic properties of the light and the atmospheric molecules. Rayleigh scattering occurs when the particle size is an order of magnitude less than the wavelength of light incident upon it. Blue sky is due to the Raleigh scattering of sunlight by the molecules in the atmosphere. If the particle size is on the order of the incident light (+ about an order of magnitude), Mie scattering is the result. Found in this regime is scattering of light by smoke, haze, smog and dust.

In the 1920s, C.V. Ramen, an Indian physicist, discovered what would become known as Raman scattering. He noted that light incident upon polyatomic molecules was inelastically scattered, as is the case with either Rayleigh or Mie scattering. Furthermore, the amount of scattering is constant for each particular molecule, and the shift in wavelength between the incident light and the Ramen scattered light depends on that type of particular molecule. Thus, if the incident wavelength is known, then the Raman scattered light is also known. If one then measures the backscattered Raman light, one can determine the amount of that particular molecule present as the two are directly related.

With the SRL setup, the lasers have been selected to provide Raman scattering from oxygen, nitrogen and water vapor. The water vapor mixing ratio is computed from the ratio of backscatter from water vapor to nitrogen.

Aerosol scattering and extinction profiles are also produced for the troposphere and lower stratosphere. The ratio of laser return (backscatter) to the nitrogen return is indicative of (Rayleigh + Mie) over (Rayleigh) scattering. A ratio of 1.0 indicates pure molecular scattering-- no aerosols. The aerosol extinction profile is derived from the derivative of the log of the nitrogen signal.

System Description

The SRL consists of two lasers providing the light source. The XeF excimer laser produces light at 351nm, and the Nd;YAG lases at 355nm. As seen in the diagram, light is produced (in this case) by the XeF laser. The light is then sent into the atmosphere via a scanning mirror. The scattered signal (whether it be Mie, Raleigh, or Raman) is collected at the mirror, concentrated in the telescope and then sent to the detectors. The detectors are photomultiplier tubes which enhance the weak backscatter signal from the aerosols and molecules.

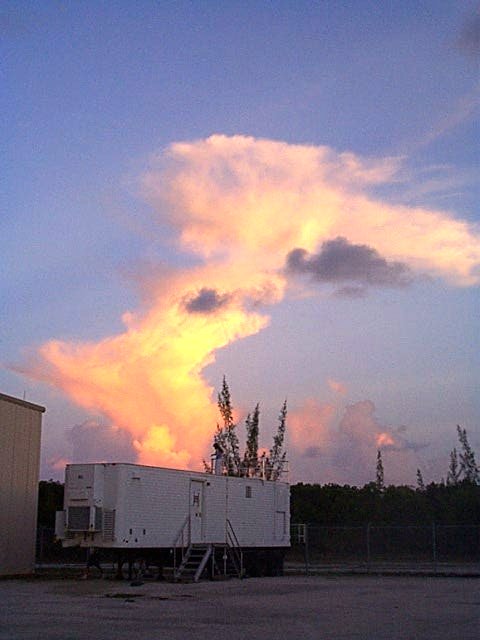
All of this equipment is located inside of one environmentally controlled trailer. This trailer is then connected via cables to a second environmentally controlled trailer (see image above) containing data acquisition and analysis equipment.This allows the SRL to be readily transportable.

SRL diagram

File Naming Convention

There are three kinds of files produced by the SRL. Two of these are data files, one each for aerosols and the other for water vapor. The third is an image (.gif) file.

Water vapor data files are named:

 98218.srl-wv-v1.txt

where

98218 is in the format yyddd, srl indicates the dataset, wv for water vapor, v1 means version 1 of the reduction software, and txt indicates the file type.

Similarly, aerosol files are named:

98218.srl-ae-v1.txt

where the only difference is ae indicating aerosol instead of watervapor.

Image files are time series representations of data files. The file 98218.srl-wv-v1.gif represents all data from the 98218.srl-wv-v1.txt file.

Data Format

The format as indicated by the file name is in ascii. The example below shows the first dozen lines of the file 98218.srl-wv-v1.txt.

160 = number of files

    0     3.2044 = file,time

    2   106 = number of header, data lines

dummy line

           Range(km)    height(km)        w (g/kg)       err (g/kg)       res (km)

    0     1.0000e-002 1.0000e-002   1.8280e+001 9.9990e+003 1.0000e-002
    1     2.3115e-001 2.3115e-001   2.0423e+001 4.0566e-002 2.2115e-001
    2     2.9198e-001 2.9198e-001   2.0498e+001 7.2385e-002 6.0830e-002
    3     3.5281e-001 3.5281e-001   2.0803e+001 1.1927e-001 6.0830e-002
    4     4.1364e-001 4.1364e-001   1.9992e+001 8.4092e-002 6.0830e-002
    5     4.7447e-001 4.7447e-001   1.9985e+001 7.4280e-002 6.0830e-002
    6     5.3530e-001 5.3530e-001   1.9392e+001 1.4833e-001 6.0830e-002

Each of these data files are made up of all of the profiles which were captured during that observation period. The number of profiles created (called files) is shown on the first line of the data file. Thus, on this date (98218 = 6 August 98) there were 160 profiles made. The second line of data indicates the particular profile number (in this case 0 ) and the time in UTC of this profile. In this case, the time is given in digital hours, and 3.2044 converts to 03:12:26 UTC.  Line three gives the number of header lines following, as well as how many data lines follow the header lines- here it indicates two header lines follow, the dummy line and the actual header line followed by 106 data lines. These correspond to the number of layers into which the vertical structure is stratified.
LIDAR graph

Data follows in this set for 160 lines and are organized into six columns. 1- bin number and has no header. 2- range from lidar in km (1.0000e-002= 0.001km). 3- altitude from lidar in km (equals "2" if lidar is pointed vertically). 4-water vapor mixing ratio in g/kg. 5- error in the water vapor mixing ratio. 6- vertical resolution of the data in km.

Data from 98218.srl-ae-v1.txt is identical for the first four lines, and begins to vary with the headings for the columnar data. Headers for the aerosols are as follows: 1- bin number and has no header. 2- range from lidar in km (1.0000e-002= 0.001km). 3- altitude from lidar in km (equals "2" if lidar is pointed vertically). 4- aerosol scattering ratio. 5- error in the scattering ratio. 6- vertical resolution of the data in km.

Errors are calculated using Poisson statistics (error equals the square root of the counts) and is propogated through the equations to obtain the given error.

IMAGERY: Images are in .gif format, and as mentioned, represent a time series of the entire data series for that date. There are three images, and they are named in a simililar format. 98218.srl-ae-v1.gif is an image of aerosol data, and 98218.srl-wv-v1.gif  is an image of the water vapor data. The third in the series is named 98218.srl-co-v1.gif which is a comparison of lidar data taken at a specific time to radiosonde data taken at the same time. An example of which is shown.

Contact Information

To order these data or for further information, please contact:

Global Hydrology Resource Center
User Services
320 Sparkman Drive
Huntsville, AL 35805
Phone: 256-961-7932
E-mail: support-ghrc@earthdata.nasa.gov
Web: http://ghrc.nsstc.nasa.gov/


ITSC

UAH

RSS feed GHRC Facebook GHRC Twitter

NASA Official:
Manil Maskey

Website maintained by the
UAH ITSC Web Team

If you have trouble viewing or
navigating this page, please contact
GHRC User Services

NASA Web Privacy Policy and Important Notices


    The GHRC is a member of the ICSU World Data System