NASA GHRC Collaboration between NASA MSFC and The University of Alabama in Huntsville
  • Access Data
    • Dataset List (HyDRO)
      • View a list of all GHRC dataset holdings using our custom search tool, HyDRO.
    • Search (HyDRO)
      • HyDRO is GHRC's custom dataset search and order tool.

        With HyDRO, you can search, discover, and filter GHRC's dataset holdings.

        HyDRO will also help you find information about browse imagery, access restrictions, and dataset guide documents.
    • NASA Earthdata Search
      • Earthdata is NASA's next generation metadata and service discovery tool, providing search and access capabilities for dataset holdings at all of the Distributed Active Archive Centers (DAACs) including the GHRC.
    • Latest Data (HyDRO)
      • View the latest additions to our data holdings using HyDRO.
  • Measurements
  • Field Campaigns
    • Hurricane Science
      • GHRC has worked with NASA's Hurricane Science Research Program (HSRP) since the 1990's. We are the archive and distribution center for data collected during HSRP field campaigns, as well as the recent Hurricane Science and Severe Storm Sentinel (HS3) Earth Venture mission. Field campaigns provide for intensive observation of specific phenomena using a variety of instruments on aircraft, satellites and surface networks.

        GHRC also hosts a database of Atlantic and Pacific tropical storm tracks derived from the storm data published by the National Hurricane Center (NHC).
    • HS3 (2012-14)
      • Hurricane and Severe Storm Sentinel (HS3) is an Earth Ventures – Suborbital 1 mission aimed at better understanding the physical processes that control hurricane intensity change, addressing questions related to the roles of environmental conditions and internal storm structures to storm intensification.

        A variety of in-situ, satellite observations, airborne data, meteorological analyses, and simulation data were collected with missions over the Atlantic in August and September of three observation years (2012, 2013, 2014). These data are available at GHRC beginning in 2015.
    • GRIP (2010)
      • The Genesis and Rapid Intensification Processes (GRIP) experiment was a NASA Earth science field experiment in 2010 that was conducted to better understand how tropical storms form and develop into major hurricanes.

        The GRIP deployment was 15 August – 30 September 2010 with bases in Ft. Lauderdale, FL for the DC-8, at Houston, TX for the WB-57, and at NASA Dryden Flight Research Facility, CA for the Global Hawk.
    • TC4 (2007)
      • The NASA TC4 (Tropical Composition, Cloud and Climate Coupling) mission investigated the structure and properties of the chemical, dynamic, and physical processes in atmosphere of the tropical Eastern Pacific.

        TC4 was based in San Jose, Costa Rica during July 2007.

        The Real Time Mission Monitor provided simultaneous aircraft status for three aircraft during the TC4 experiment. During TC4, the NASA ER-2, WB-57 and DC-8 aircraft flew missions at various times. The science flights were scheduled between 17 July and 8 August 2007.
    • NAMMA (2006)
      • The NASA African Monsoon Multidisciplinary Analyses (NAMMA) campaign was a field research investigation based in the Cape Verde Islands, 350 miles off the coast of Senegal in west Africa.

        Commenced in August 2006, NASA scientists employed surface observation networks and aircraft to characterize the evolution and structure of African Easterly Waves (AEWs) and Mesoscale Convective Systems over continental western Africa, and their associated impacts on regional water and energy budgets.
    • TCSP (2005)
      • The Tropical Cloud Systems and Processes (TCSP) mission was an Earth science field research investigation focused on the study of the dynamics and thermodynamics of precipitating cloud systems and tropical cyclones. TCSP was conducted during the period July 1-27, 2005 out of the Juan Santamaria Airfield in San Jose, Costa Rica.

        The TCSP field experiment flew 12 NASA ER-2 science flights, including missions to Hurricanes Dennis and Emily, Tropical Storm Gert and an eastern Pacific mesoscale complex that may possibly have further developed into Tropical Storm Eugene.
    • ACES (2002)
      • The Altus Cumulus Electrification Study (ACES) was aimed at better understanding the causes and effects of electrical storms.

        Based at the Naval Air Station Key West in Florida, researchers in August 2002 chased down thunderstorms using an uninhabited aerial vehicle, or "UAV", allowing them to achieve dual goals of gathering weather data safely and testing new aircraft technology. This marked the first time a UAV was used to conduct lightning research.
    • CAMEX-4 (2001)
      • The Convection And Moisture EXperiment (CAMEX) was a series of NASA-sponsored hurricane science field research investigations. The fourth field campaign in the CAMEX series (CAMEX-4) was held in 16 August - 24 September, 2001 and was based out of Jacksonville Naval Air Station, Florida.

        CAMEX-4 was focused on the study of tropical cyclone (hurricane) development, tracking, intensification, and landfalling impacts using NASA-funded aircraft and surface remote sensing instrumentation.
    • CAMEX-3 (1998)
      • The Convection And Moisture EXperiment (CAMEX) is a series of hurricane science field research investigations sponsored by NASA. The third field campaign in the CAMEX series (CAMEX-3) was based at Patrick Air Force Base, Florida from 6 August - 23 September, 1998.

        CAMEX-3 successfully studied Hurricanes Bonnie, Danielle, Earl and Georges, yielding data on hurricane structure, dynamics, and motion. CAMEX-3 collected data for research in tropical cyclone development, tracking, intensification, and landfalling impacts using NASA-funded aircraft and surface remote sensing instrumentation.
    • GPM Ground Validation
      • The NASA Global Precipitation Measurement Mission (GPM) Ground Validation (GV) program includes the following field campaigns:

        a) LPVEx, Gulf of Finland in autumn 2010, to study rainfall in high latitude environments

        b) MC3E, cental Oklahoma spring and early summer 2011, to develop a complete characterization of convective cloud systems, precipitation and the environment

        c) GCPEx, Ontario, Canada winter of 2011-2012, direct and remove sensing observations, and coordinated model simulations of precipitating snow.

        d) IFloodS, Iowa, spring and early summer 2013, to study the relative roles of rainfall quantities and other factors in flood genesis.

        e) IPHEx, N. Carolina Appalachians/Piedmont region May-June 2014, for hydrologic validation over varied topography.

        f) OLYMPEx, Washington's Olympic Peninsula scheduled November 2015-February 2016, for hydrologic validation in extreme coastal and topographic gradients
    • OLYMPEX (Upcoming)
      • The OLYMPEX field campaign is scheduled to take place between November, 2015, and February, 2016, on the Olympic Peninsula in the Pacific Northwest of the United States.

        This field campaign will provide ground-based validation support of the Global Precipitation Measurement (GPM) satellite program that is a joint effort between NASA and JAXA.

        As for all GPM-GV campaigns, the GHRC will provide a collaboration portal to help investigators exchange planning information and to support collection of real-time data as well as mission science, project and instrument status reports during the campaign.
    • IPHEx (2014)
      • The Integrated Precipitation and Hydrology Experiment (IPHEx) was conducted in North Carolina during the months of April-June, 2014.

        IPHEx sought to characterize warm season orographic precipitation regimes, and the relationship between precipitation regimes and hydrologic processes in regions of complex terrain.
    • IFLOODs (2013)
      • The Iowa Flood Studies (IFloodS) experiment was conducted in the central to northeastern part of Iowa in Midwestern United States during the months of April-June, 2013.

        IFloodS' primary goal was to discern the relative roles of rainfall quantities such as rate and accumulation as compared to other factors (e.g. transport of water in the drainage network) in flood genesis.
    • GCPEX (2011-2012)
      • The GPM Cold-season Precipitation Experiment (GCPEx) occurred in Ontario, Canada during the winter season (Jan 15- Feb 26) of 2011-2012.

        GCPEx addressed shortcomings in GPM snowfall retrieval algorithm by collecting microphysical properties, associated remote sensing observations, and coordinated model simulations of precipitating snow. Collectively the GCPEx data set provides a high quality, physically-consistent and coherent data set suited to the development and testing of GPM snowfall retrieval algorithm physics.
    • MC3E (2011)
      • The Mid-latitude Continental Convective Clouds Experiment (MC3E) took place in central Oklahoma during the April–June 2011 period.

        The overarching goal was to provide the most complete characterization of convective cloud systems, precipitation, and the environment that has ever been obtained, providing constraints for model cumulus parameterizations and space-based rainfall retrieval algorithms over land that had never before been available.
    • LPVEx (2010)
      • The Light Precipitation Evaluation Experiment (LPVEx) took place in the Gulf of Finland in September and October, 2010 and collected microphysical properties, associated remote sensing observations, and coordinated model simulations of high latitude precipitation systems to drive the evaluation and development of precipitation algorithms for current and future satellite platforms.

        In doing so, LPVEx sought to address the general lack of dedicated ground-validation datasets from the ongoing development of new or improved algorithms for detecting and quantifying high latitude rainfall
  • Projects
    • HS3 Suborbital Mission
      • Hurricane and Severe Storm Sentinel (HS3) is an Earth Ventures – Suborbital 1 mission aimed at better understanding the physical processes that control hurricane intensity change, addressing questions related to the roles of environmental conditions and internal storm structures to storm intensification.
    • DISCOVER - MEaSUREs
      • DISCOVER was funded by NASA’s MEaSUREs program to provide highly accurate, multi-decadal geophysical products derived from satellite microwave sensors.
    • LIS Mission
      • Lightning observations from the Lightning Imaging Sensors (LIS) aboard the NASA’s TRMM satellite and International Space Station, as well as airborne observations and ground validation data.
    • SANDS
      • The SANDS project addressed Gulf of Mexico Alliance priority issues by generating enhanced imagery from MODIS and Landsat data to identify suspended sediment resulting from tropical cyclones. These tropical cyclones have significantly altered normal coastal processes and characteristics in the Gulf region through sediment disturbance.
    • LANCE AMSR2
      • The Land, Atmosphere Near real-time Capability for EOS (LANCE) system provides access to near real-time data (less than 3 hours from observation) from AIRS, AMSR2, MLS, MODIS, and OMI instruments. LANCE AMSR2 products are generated by the AMSR Science Investigator-led Processing System at the GHRC.
  • Resources
    • Tools & Technologies
      • A collection of tools & technologies developed and/or used by GHRC.
    • Publications
      • View GHRC & ITSC publications on the ITSC website
    • Innovations Lab
      • The GHRC Innovations Lab is a showcase for emerging geoinformatics technologies resulting from NASA-sponsored research at the University of Alabama in Huntsville.
    • Educational Resources
      • A list of resources from NASA, MSFC, and other sources for teachers and students focused on global change, hydrology, and science education.
    • Referencing our data
      • GHRC dataset citation help and examples.
    • Documents
      • Documentation related to GHRC datasets, software, and other offerings.
    • Glossary
      • Terms and their definitions
    • Featured items
      • The latest tools from GHRC.
  • Multimedia
  • About
    • Welcome
      • Local resources, lodging information, and weather to help you plan your visit to GHRC.
    • GHRC Personnel
      • A list to help you keep in touch with our personnel
    • FAQ
      • Frequently Asked Questions about GHRC data and services, and their answers.
    • Data Citations and Acknowledgements
      • GHRC dataset citation help and examples
  • Cite Us
  • Contact Us
feedback
DOCUMENTATION

Documentation

Guide Documents

Dataset PI Documents

Dataset Software

CAMEX-4 ER-2 High Altitude Dropsonde (EHAD)

Table of Contents

Introduction
Content and structure of the EHAD files
Browse Images: Drop#_hhmmss.jpg
QC data file: d20010910_155810.QCcls
Contact Information

Introduction

The ER-2 Hight Altitude Dropsonde (EHAD) system uses Global Positioning System (GPS) dropwindsondes to measure vertical profiles of pressure, temperature, humidity, and wind during descent to the surface. CAMEX-4 was EHAD's first operational deployment. A total of 25 sondes were released.

Vertical measurement of the atmosphere goes back many decades with the current dropwindsonde coming into being in 1993. Working in collaboration with the National Oceanic and Atmospheric Administration/ Atlantic Oceanographic and Meteorological Laboratory (NOAA/AOML) and the German Aerospace Research Establishment (DLR), the National Center for Atmospheric Research/ Atmosphere Technology Division (NCAR/ATD) developed a third-generation dropwindsonde using a new sensor module and a GPS receiver from Vaisala, Inc. More accurate wind profiles are now available because of a NCAR/ATD-developed, unique square-cone parachute that reduces the initial shock load and stabilizes the dropwindsonde as it falls. The dropswindsondes are the responsibility of NCAR/ATD/Surface and Sounding Systems Facility who provided the final post experiment quality control processing.

These sondes were further modified to operate from the newly developed EHAD system. Capable of carrying up to 17 sondes in a special pod mounted ventrally on the centerline of the ER-2, the system promised to provide sounding data from an altitude never before obtained in the tropical storm environment. Unlike sondes released from the AVAPS system, sondes are mounted in the EHAD pod are automatically selected and preflighted. Launch is commanded by the ER-2 pilot, and the sonde is spring ejected from the pod. Launched at approximately 20km (65,000ft), the sonde takes almost a full thirty minutes to reach the surface. .

The GPS dropsonde page at ATD at http://www.atd.ucar.edu/sssf/facilities/dropsonde/gpsDropsonde.html contains details about the sonde itself, and the EHAD system.

Content and structure of the EHAD files

There are twofiles associated with each dropwindsonde released during the experiment: an image of the sounding, a QCed data file, and finally the World Meteorological Organization (WMO) code file (discussed below). These three files are 'tarred' into a daily/mission file with the following naming convention: c4eehad_2001.ddd_01-mmm.tar where c4eehad is the designator for the ER-2 High Altitude dropsonde data, 2001.ddd is year and day of year, 01-mmm where mmm is the ER-2 sortie number, and tar indicates 'tar' file.

Once 'untarred' there will be two files whose naming convention is very straightforward. Images (in .jpg format) are named Drop#_hhmmss.jpg where the # is the release sequence number and hhmmss is the time of the drop. The other file is the QCed sounding with data in tabular form. This has the file name in the form Dyyyymmdd_hhmmss.QCcls, where D identifies this as data, yyyymmdd is year month date (e.g. 20010908) and hhmmss is the release time in hours, minutes and seconds, and QCcls is for the QC data file in CLASS format.

Browse Images: Drop#_hhmmss.jpg

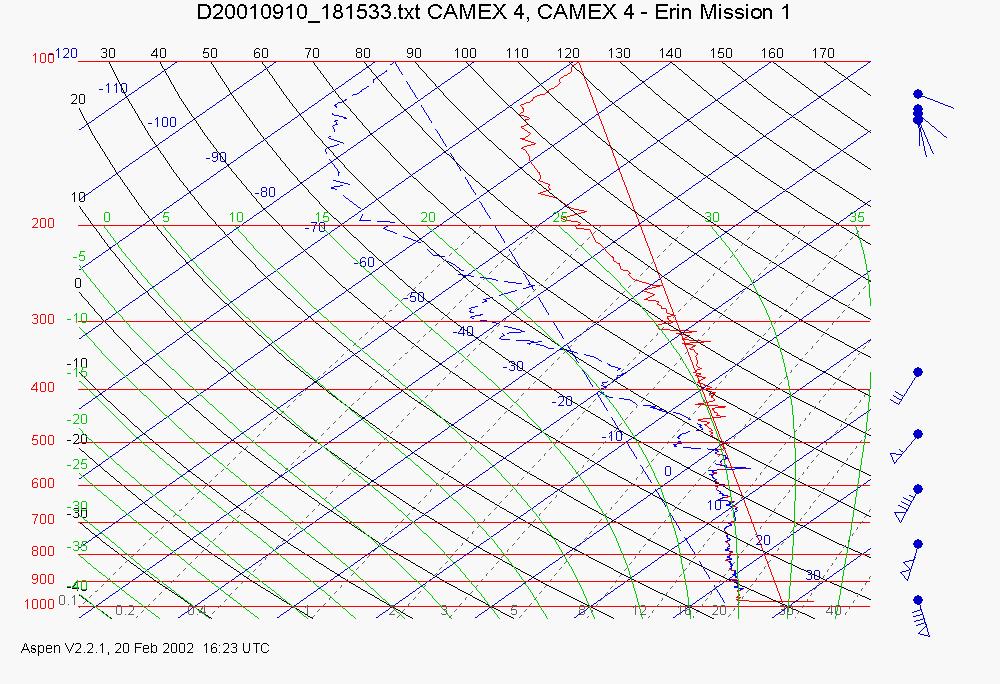
The suffix '.jpg' identifies this browse image as a plotted sounding in JPG format. The skew-T diagram shows the temperature, dewpoint, and vertical wind profiles measured during the flight of the dropwindsonde. Date, time of release, and mission ID are given in the title of the image. An example of the browse image named Drop5.jpg is shown below:

example of browse image

QC data file: d20010910_155810.QCcls

A sample is shown here. Data is in CLASS format- click here for more information. For the purpose of this document, this data has been formatted so that lines are not broken. One simple way to obtain neatly aligned data is to import the raw data text file into a spreadsheet (e.g. Excel) for automatic formatting.

Close examination will reveal that the file reads backwards in time from the top of the file to the bottom, consequently pressures decrease from top to bottom making it appear to be a surface sounding. This is the data file as it appears following quality control by NCAR. Otherwise, the file is self explanatory.

Contact Information

To order these data or for further information, please contact:

Global Hydrology Resource Center
User Services
320 Sparkman Drive
Huntsville, AL 35805
Phone: 256-961-7932
E-mail: support-ghrc@earthdata.nasa.gov
Web: http://ghrc.nsstc.nasa.gov/

ITSC

UAH

RSS feed GHRC Facebook GHRC Twitter

NASA Official:
Manil Maskey

Website maintained by the
UAH ITSC Web Team

If you have trouble viewing or
navigating this page, please contact
GHRC User Services

NASA Web Privacy Policy and Important Notices


    The GHRC is a member of the ICSU World Data System