NASA GHRC Collaboration between NASA MSFC and The University of Alabama in Huntsville
  • Access Data
    • Dataset List (HyDRO)
      • View a list of all GHRC dataset holdings using our custom search tool, HyDRO.
    • Search (HyDRO)
      • HyDRO is GHRC's custom dataset search and order tool.

        With HyDRO, you can search, discover, and filter GHRC's dataset holdings.

        HyDRO will also help you find information about browse imagery, access restrictions, and dataset guide documents.
    • NASA Earthdata Search
      • Earthdata is NASA's next generation metadata and service discovery tool, providing search and access capabilities for dataset holdings at all of the Distributed Active Archive Centers (DAACs) including the GHRC.
    • Latest Data (HyDRO)
      • View the latest additions to our data holdings using HyDRO.
  • Measurements
  • Field Campaigns
    • Hurricane Science
      • GHRC has worked with NASA's Hurricane Science Research Program (HSRP) since the 1990's. We are the archive and distribution center for data collected during HSRP field campaigns, as well as the recent Hurricane Science and Severe Storm Sentinel (HS3) Earth Venture mission. Field campaigns provide for intensive observation of specific phenomena using a variety of instruments on aircraft, satellites and surface networks.

        GHRC also hosts a database of Atlantic and Pacific tropical storm tracks derived from the storm data published by the National Hurricane Center (NHC).
    • HS3 (2012-14)
      • Hurricane and Severe Storm Sentinel (HS3) is an Earth Ventures – Suborbital 1 mission aimed at better understanding the physical processes that control hurricane intensity change, addressing questions related to the roles of environmental conditions and internal storm structures to storm intensification.

        A variety of in-situ, satellite observations, airborne data, meteorological analyses, and simulation data were collected with missions over the Atlantic in August and September of three observation years (2012, 2013, 2014). These data are available at GHRC beginning in 2015.
    • GRIP (2010)
      • The Genesis and Rapid Intensification Processes (GRIP) experiment was a NASA Earth science field experiment in 2010 that was conducted to better understand how tropical storms form and develop into major hurricanes.

        The GRIP deployment was 15 August – 30 September 2010 with bases in Ft. Lauderdale, FL for the DC-8, at Houston, TX for the WB-57, and at NASA Dryden Flight Research Facility, CA for the Global Hawk.
    • TC4 (2007)
      • The NASA TC4 (Tropical Composition, Cloud and Climate Coupling) mission investigated the structure and properties of the chemical, dynamic, and physical processes in atmosphere of the tropical Eastern Pacific.

        TC4 was based in San Jose, Costa Rica during July 2007.

        The Real Time Mission Monitor provided simultaneous aircraft status for three aircraft during the TC4 experiment. During TC4, the NASA ER-2, WB-57 and DC-8 aircraft flew missions at various times. The science flights were scheduled between 17 July and 8 August 2007.
    • NAMMA (2006)
      • The NASA African Monsoon Multidisciplinary Analyses (NAMMA) campaign was a field research investigation based in the Cape Verde Islands, 350 miles off the coast of Senegal in west Africa.

        Commenced in August 2006, NASA scientists employed surface observation networks and aircraft to characterize the evolution and structure of African Easterly Waves (AEWs) and Mesoscale Convective Systems over continental western Africa, and their associated impacts on regional water and energy budgets.
    • TCSP (2005)
      • The Tropical Cloud Systems and Processes (TCSP) mission was an Earth science field research investigation focused on the study of the dynamics and thermodynamics of precipitating cloud systems and tropical cyclones. TCSP was conducted during the period July 1-27, 2005 out of the Juan Santamaria Airfield in San Jose, Costa Rica.

        The TCSP field experiment flew 12 NASA ER-2 science flights, including missions to Hurricanes Dennis and Emily, Tropical Storm Gert and an eastern Pacific mesoscale complex that may possibly have further developed into Tropical Storm Eugene.
    • ACES (2002)
      • The Altus Cumulus Electrification Study (ACES) was aimed at better understanding the causes and effects of electrical storms.

        Based at the Naval Air Station Key West in Florida, researchers in August 2002 chased down thunderstorms using an uninhabited aerial vehicle, or "UAV", allowing them to achieve dual goals of gathering weather data safely and testing new aircraft technology. This marked the first time a UAV was used to conduct lightning research.
    • CAMEX-4 (2001)
      • The Convection And Moisture EXperiment (CAMEX) was a series of NASA-sponsored hurricane science field research investigations. The fourth field campaign in the CAMEX series (CAMEX-4) was held in 16 August - 24 September, 2001 and was based out of Jacksonville Naval Air Station, Florida.

        CAMEX-4 was focused on the study of tropical cyclone (hurricane) development, tracking, intensification, and landfalling impacts using NASA-funded aircraft and surface remote sensing instrumentation.
    • CAMEX-3 (1998)
      • The Convection And Moisture EXperiment (CAMEX) is a series of hurricane science field research investigations sponsored by NASA. The third field campaign in the CAMEX series (CAMEX-3) was based at Patrick Air Force Base, Florida from 6 August - 23 September, 1998.

        CAMEX-3 successfully studied Hurricanes Bonnie, Danielle, Earl and Georges, yielding data on hurricane structure, dynamics, and motion. CAMEX-3 collected data for research in tropical cyclone development, tracking, intensification, and landfalling impacts using NASA-funded aircraft and surface remote sensing instrumentation.
    • GPM Ground Validation
      • The NASA Global Precipitation Measurement Mission (GPM) Ground Validation (GV) program includes the following field campaigns:

        a) LPVEx, Gulf of Finland in autumn 2010, to study rainfall in high latitude environments

        b) MC3E, cental Oklahoma spring and early summer 2011, to develop a complete characterization of convective cloud systems, precipitation and the environment

        c) GCPEx, Ontario, Canada winter of 2011-2012, direct and remove sensing observations, and coordinated model simulations of precipitating snow.

        d) IFloodS, Iowa, spring and early summer 2013, to study the relative roles of rainfall quantities and other factors in flood genesis.

        e) IPHEx, N. Carolina Appalachians/Piedmont region May-June 2014, for hydrologic validation over varied topography.

        f) OLYMPEx, Washington's Olympic Peninsula scheduled November 2015-February 2016, for hydrologic validation in extreme coastal and topographic gradients
    • OLYMPEX (Upcoming)
      • The OLYMPEX field campaign is scheduled to take place between November, 2015, and February, 2016, on the Olympic Peninsula in the Pacific Northwest of the United States.

        This field campaign will provide ground-based validation support of the Global Precipitation Measurement (GPM) satellite program that is a joint effort between NASA and JAXA.

        As for all GPM-GV campaigns, the GHRC will provide a collaboration portal to help investigators exchange planning information and to support collection of real-time data as well as mission science, project and instrument status reports during the campaign.
    • IPHEx (2014)
      • The Integrated Precipitation and Hydrology Experiment (IPHEx) was conducted in North Carolina during the months of April-June, 2014.

        IPHEx sought to characterize warm season orographic precipitation regimes, and the relationship between precipitation regimes and hydrologic processes in regions of complex terrain.
    • IFLOODs (2013)
      • The Iowa Flood Studies (IFloodS) experiment was conducted in the central to northeastern part of Iowa in Midwestern United States during the months of April-June, 2013.

        IFloodS' primary goal was to discern the relative roles of rainfall quantities such as rate and accumulation as compared to other factors (e.g. transport of water in the drainage network) in flood genesis.
    • GCPEX (2011-2012)
      • The GPM Cold-season Precipitation Experiment (GCPEx) occurred in Ontario, Canada during the winter season (Jan 15- Feb 26) of 2011-2012.

        GCPEx addressed shortcomings in GPM snowfall retrieval algorithm by collecting microphysical properties, associated remote sensing observations, and coordinated model simulations of precipitating snow. Collectively the GCPEx data set provides a high quality, physically-consistent and coherent data set suited to the development and testing of GPM snowfall retrieval algorithm physics.
    • MC3E (2011)
      • The Mid-latitude Continental Convective Clouds Experiment (MC3E) took place in central Oklahoma during the April–June 2011 period.

        The overarching goal was to provide the most complete characterization of convective cloud systems, precipitation, and the environment that has ever been obtained, providing constraints for model cumulus parameterizations and space-based rainfall retrieval algorithms over land that had never before been available.
    • LPVEx (2010)
      • The Light Precipitation Evaluation Experiment (LPVEx) took place in the Gulf of Finland in September and October, 2010 and collected microphysical properties, associated remote sensing observations, and coordinated model simulations of high latitude precipitation systems to drive the evaluation and development of precipitation algorithms for current and future satellite platforms.

        In doing so, LPVEx sought to address the general lack of dedicated ground-validation datasets from the ongoing development of new or improved algorithms for detecting and quantifying high latitude rainfall
  • Projects
    • HS3 Suborbital Mission
      • Hurricane and Severe Storm Sentinel (HS3) is an Earth Ventures – Suborbital 1 mission aimed at better understanding the physical processes that control hurricane intensity change, addressing questions related to the roles of environmental conditions and internal storm structures to storm intensification.
    • DISCOVER - MEaSUREs
      • DISCOVER was funded by NASA’s MEaSUREs program to provide highly accurate, multi-decadal geophysical products derived from satellite microwave sensors.
    • LIS Mission
      • Lightning observations from the Lightning Imaging Sensors (LIS) aboard the NASA’s TRMM satellite and International Space Station, as well as airborne observations and ground validation data.
    • SANDS
      • The SANDS project addressed Gulf of Mexico Alliance priority issues by generating enhanced imagery from MODIS and Landsat data to identify suspended sediment resulting from tropical cyclones. These tropical cyclones have significantly altered normal coastal processes and characteristics in the Gulf region through sediment disturbance.
    • LANCE AMSR2
      • The Land, Atmosphere Near real-time Capability for EOS (LANCE) system provides access to near real-time data (less than 3 hours from observation) from AIRS, AMSR2, MLS, MODIS, and OMI instruments. LANCE AMSR2 products are generated by the AMSR Science Investigator-led Processing System at the GHRC.
  • Resources
    • Tools & Technologies
      • A collection of tools & technologies developed and/or used by GHRC.
    • Publications
      • View GHRC & ITSC publications on the ITSC website
    • Innovations Lab
      • The GHRC Innovations Lab is a showcase for emerging geoinformatics technologies resulting from NASA-sponsored research at the University of Alabama in Huntsville.
    • Educational Resources
      • A list of resources from NASA, MSFC, and other sources for teachers and students focused on global change, hydrology, and science education.
    • Referencing our data
      • GHRC dataset citation help and examples.
    • Documents
      • Documentation related to GHRC datasets, software, and other offerings.
    • Glossary
      • Terms and their definitions
    • Featured items
      • The latest tools from GHRC.
  • Multimedia
  • About
    • Welcome
      • Local resources, lodging information, and weather to help you plan your visit to GHRC.
    • GHRC Personnel
      • A list to help you keep in touch with our personnel
    • FAQ
      • Frequently Asked Questions about GHRC data and services, and their answers.
    • Data Citations and Acknowledgements
      • GHRC dataset citation help and examples
  • Cite Us
  • Contact Us
feedback
DOCUMENTATION

Documentation

Guide Documents

Dataset PI Documents

Dataset Software

TCSP ER-2 MODIS Airborne Simulator (MAS)

Table of Contents

Introduction
Instrument Description
Documentation
Data Description and Format
File Naming
Software
References
Contact Information

Introduction

TCSP ER-2 MODIS Airborne Simulator (MAS)The MODIS Airborne Simulator (MAS) data were collected in support of The Tropical Cloud Systems and Processes mission (TCSP), conducted by NASA and the National Oceanic and Atmospheric Administration (NOAA) in Costa Rica throughout July 2005. The TCSC mission collected data for reasearch and documention of "cyclogenesis", the interaction of temperature, humidity, precipitation, wind and air pressure that creates ideal birthing conditions for tropical storms, hurricanes and related phenomena. The goal of this mission was to help us better understand how hurricanes and other tropical storms are formed and intensify.

The MODIS Airborne Simulator (MAS) is a scanning spectrometer which flies on a NASA ER-2 high altitude research aircraft. It measures reflected solar and emitted thermal radiation in 50 narrowband channels between 0.46 and 14.3 microns (specifications). MAS produces image data with 50 meter resolution (at nadir) across a 37 kilometer ground swath from a nominal altitude of 20 kilometers.

Instrument Description

The MAS is a multi-spectral line-scanning spectrometer that acquires image data in 50 spectral bands over wavelengths ranging from 0.46 to 14.3 microns. Flown on an ER-2 aircraft at an operating altitude of 19.8 kilometers (65,000 ft.) it produces image data with 50 meter resolution (at nadir), across a 37 kilometer ground swath. MAS includes nine spectral bands in the visible/near infrared, 16 bands in the shortwave infrared, 16 bands in the mid-wave infrared, and nine bands in the thermal infrared regions of the spectrum. The instrument field-of-view is 86 degrees, with an IFOV of 2.5 mrad.

Additional information may be found here.

Documentation

Extensive documentation about the instrument, calibration, geolocation and data extraction can be found in the MAS Level-1B Data User's Guide, as supplied by the AMES MODIS Airborne Simulator Documents and Research web site: http://mas.arc.nasa.gov/reference/guide.html

Data Description and Format

MAS data were collected continuously at 6.25 scans per second during an ER-2 flight (at altitude). Only straight and level flight tracks were archived. Each file represents a unique time segment from a particular flight.

The MAS data resolution consists of 50 meter pixels at nadir, at 19.8 km altitude. Swath width is 36 km (across-track).

The data are processed to Level-1B geo-located multi-spectral visible and infrared imagery and calibrated to at-sensor radiance of watts/meter2/steradian/micron. The data are in HDF format (version 4.1.4).

File Naming

The data files for each ER-2 flight have been compressed via "gzip", and bundled into a single "sortie" file via the unix "tar" command, and they look like this:

tcspmas_yyyy.ddd_05fff.tar

Where "yyyy.ddd" is the year and 'day of year', and "05fff" is the ER-2 sortie number. This tar file will contain all HDF data files for the sortie, all browse files for the sortie, a trackmap file showing the flight path, a flight summary file, and a nadir profile file for the flight. Example files included in each bundle are:

Data: MASL1B_05921_01_20050618_1421_1433_V01.hdf.gz

<instr + processing level>_<sortie>_<track>_<date (yyyymmdd)>_<start time (hhmm)>_<end time (hhmm)>_<version number>.<HDF format>.<compressed via gzip>

Browse: tcspmas_05921_01.jpg

<fieldexp-inst>_<sortie#>_<sequence number>.jpg

Flight track: tcspmas_05921tm.gif

<fieldexp-inst>_<sortie#><track map>.gif

Nadir profile: tcspmas_05921.Nadir.txt

<fieldexp-inst>_<sortie#><Nadir>.txt

Summary: tcspmas_05935.sum

<fieldexp-inst>_<sortie#>.sum

Each flight contains a flight information (sumary) file in ASCII format with the extension .sum. These files give information on each of the flight tracks (lat, lon, time, solar elevation and azimuth and aircraft heading at the start of the track) as well as what are called 'Global Attributes'. Global Attributes include mission specific information (aircraft, dates, etc.). An example is shown below:

Each flight also has a Nadir profile file, which list the processing inputs for the 50 channel scanner, using 2 visual and 2 IR nadir pixel bands.

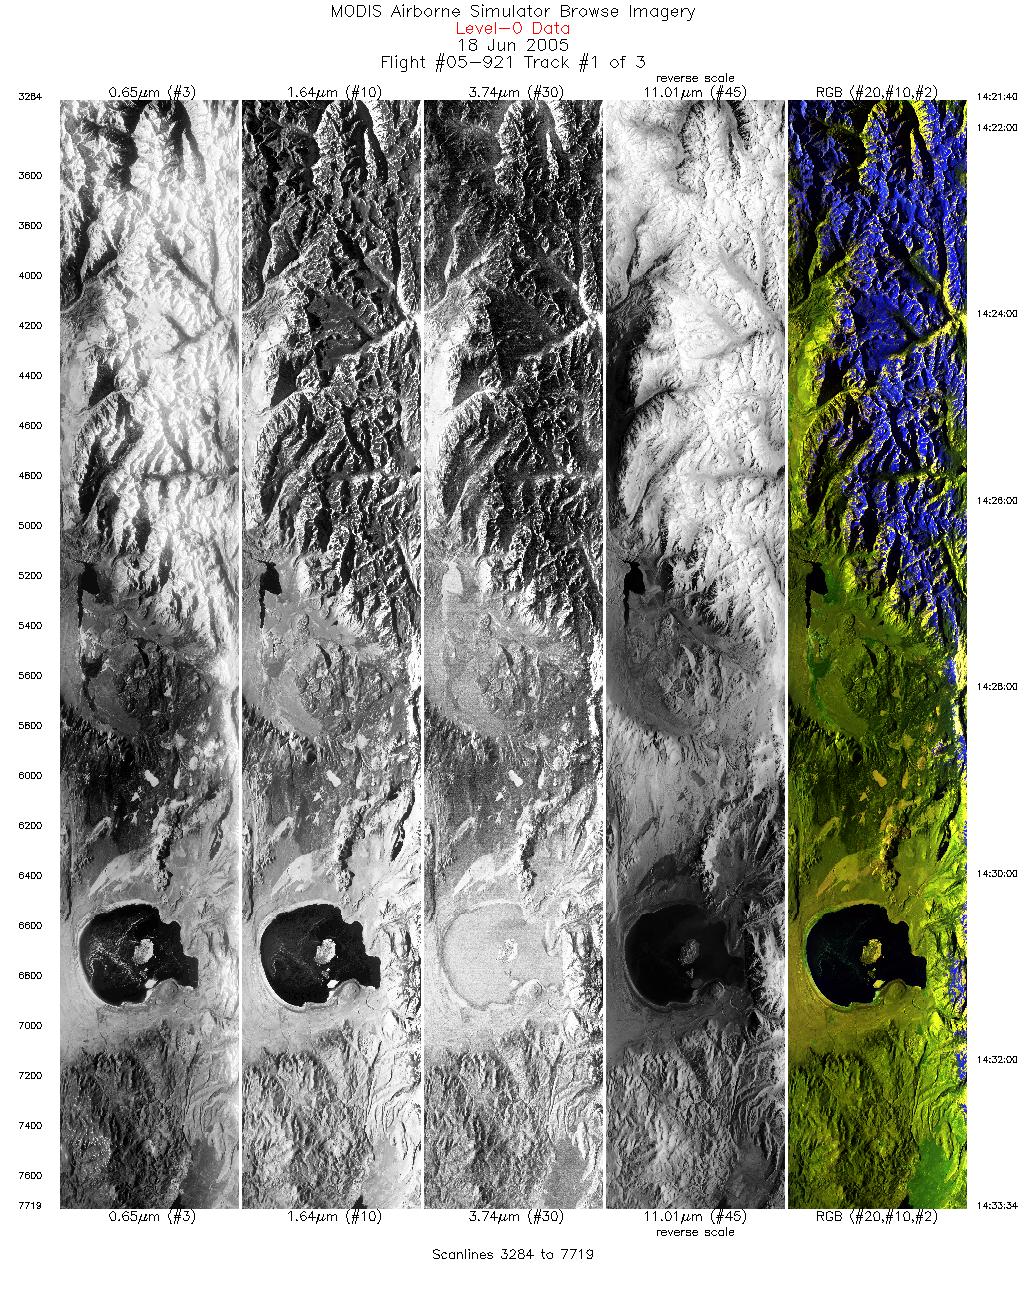
There is a flight path browse, in 'gif' format, as shown at the right. Also included is a browse of the data, in 'jpg' format, one for each track during the sortie. An example browse is shown below, which was taken over Mono Lake, CA. This is browse file tcspmas_05921_01.jpg.

Note that the naming convention describes a jpg image from MAS during the TCSP experiment, mission number 05-921, the first track.

Software

MAS Level-1B data are stored in Hierarchical Data Format, version 4, (HDF4), and should only be accessed through the proper HDF4 librarys. HDF software is available from NCSA through their web site: http://hdf.ncsa.uiuc.edu/. Both IDL/ENVI and MatLab can be used to read MAS HDF data. General help on how to read these data, and other available software, can be found at the following AMES web site: http://mas.arc.nasa.gov/reference/unpacking.html.

References

King, M. D., W. P. Menzel, P. S. Grant, J. S. Myers, G. T. Arnold, S. E. Platnick, L. E. Gumley, S. C. Tsay, C. C. Moeller, M. Fitzgerald, K. S. Brown and F. G. Osterwisch, 1996: Airborne scanning spectrometer for remote sensing of cloud, aerosol, water vapor and surface properties. J. Atmos. Oceanic Technol., 13, 777-794.

Arnold, G.T., M. Fitzgerald, P.S. Grant, and M.D. King, 1994a: MODIS Airborne Simulator Visible and Near-Infrared Calibration - 1991 FIRE-Cirrus Field Experiment. NASA Goddard Space Flight Center, NASA Technical Memorandum 104600.

Arnold, G.T., M. Fitzgerald, P.S. Grant, and M.D. King, 1994b: MODIS Airborne Simulator Visible and Near-Infrared Calibration - 1992 ASTEX Field Experiment. NASA Goddard Space Flight Center, NASA Technical Memorandum 104599.

Jedlovec, G.J., K.B. Batson, R.J. Atkinson, C.C. Moeller, W.P. Menzel, and M.W. James, 1989: Improved Capabilities of the Multispectral Atmospheric Mapping Sensor (MAMS). NASA Marshall Space Flight Center, NASA Technical Memorandum 100352.

King, M. D., Y. J. Kaufman, W. P. Menzel and D. Tanré, 1992: Remote sensing of cloud, aerosol, and water vapor Properties from the Moderate Resolution Imaging Spectrometer (MODIS). IEEE Trans. Geosci. Remote Sens., 30, 2-27

Contact Information

To order these data or for further information, please contact:

Global Hydrology Resource Center
User Services
320 Sparkman Drive
Huntsville, AL 35805
Phone: 256-961-7932
E-mail: support-ghrc@earthdata.nasa.gov
Web: http://ghrc.nsstc.nasa.gov/


ITSC

UAH

RSS feed GHRC Facebook GHRC Twitter

NASA Official:
Manil Maskey

Website maintained by the
UAH ITSC Web Team

If you have trouble viewing or
navigating this page, please contact
GHRC User Services

NASA Web Privacy Policy and Important Notices


    The GHRC is a member of the ICSU World Data System