
|
CAMEX-3 Cloud and Aerosol Particle Characterization (CAPAC) and CAPAC Video (CAPACV) Table of Contents
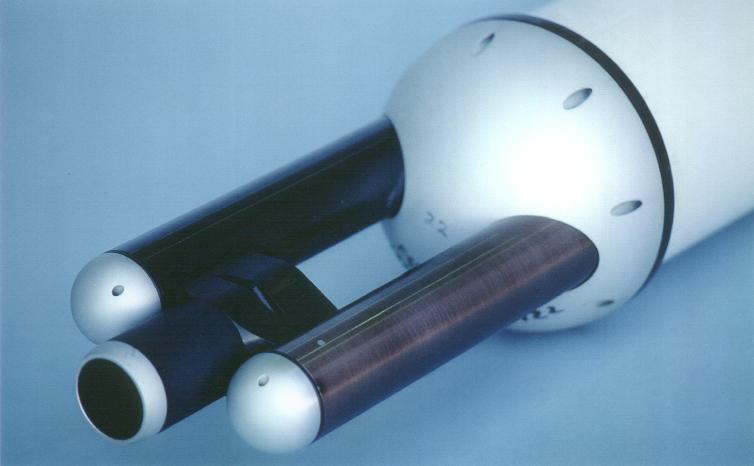
CAPAC is a series of three instruments. The first is the Forward Scattering Spectrometer Probe model 300 (FSSP-300), the Two Dimensional Optical Array Probes [Cloud and Precipitation Probes (2D-P)] and the CAPAC video. These instruments flew during CAMEX-3 upon the NASA DC-8 mounted on the left wing. The FSSP 300 is an instrument developed by Particle Measuring Systems (PMS Inc., Boulder, Co) for the measurement of aerosol particle size distributions. The sensor was originally developed for the study of stratospheric aerosol distributions and polar stratospheric clouds but is now widely utilized in studies of tropospheric chemistry and aerosol physics. The two dimensional probes 2D-P, are instruments developed by Particle Measuring Systems (PMS Inc., Boulder, Co) for the measurement of cloud and precipitation drop size distributions. These sensors are used primarily for the study of cloud microphysical processes, particularly the growth of cloud drops and ice crystals through aggregation, riming and coalescence into drizzle, rain drops, graupel or other forms of precipitation. CAPAC videos are a visual record of the particles and hydrometeors passing through the instrument housing. Instrument Description and Operating PrinciplesFSSP-300 
The FSSP-300 is of that general class of instruments called optical particle counters (OPCs) that detect single particles and size them by measuring the intensity of light that the particle scatters when passing through a light beam.
The schematic diagram shown above illustrates the optical path of this instrument.
A Helium Neon laser beam is focused to a small diameter at the center of an inlet that faces into the oncoming airstream. This laser beam is blocked on the opposite side of the inlet with an optical stop, a "dump spot" to prevent the beam from entering the collection optics. Particles that encounter this beam scatter light in all directions and some of that scattered in the forward direction is directed by a right angle prism though a condensing lens and onto a beam splitter. The "dump spot" on the prism and aperture of the condensing lens define a collection angle from about 4o - 12o. The beam splitter divides the scattered light into two components, each of which impinge on a photodetector. One of these detectors, however, is optically masked to receive only scattered light when the particles pass through the laser beam within a region 0.5 mm either side of the center of focus. Particles that fall outside that region are rejected when the signal from the unmasked detector exceeds that from the masked detector. This defines the sample volume that is needed in order to calculate particle concentrations. The size of the particle is determined by measuring the light scattering intensity and using Mie scattering theory to relate this intensity to the particle size. The size that is determined by the FSSP assumes that the scattered light detected is from a spherical particle of refractive index 1.58. The size distributions produced from these measurements must be viewed with great caution when in mixed composition aerosols. Particles will not be correctly sized due to their different refractive index and non-spherical shapes. Once measured, the particle size is categorized into one of 31 channels (bins) and this information is sent to the data system where the number of particles in each channel is accumulated over a preselected time period. Particles in sizes from 0.42x10⁻³cm to 23.67x10⁻³cm are measured. See the table in the data section below for actual bin size limits, and an example of data. FSSP-300 is contained in a canister that is mounted on an aircraft pylon below the left wing projecting into the free air stream. The 2DP record the two dimensional shadows of hydrometeors as they pass through a focussed He-Ne laser beam as shown in the adjacent diagram. The shadow is cast onto a linear diode array and the on/off state of these diodes is stored during the particle's passage through the laser beam. This information, along with the time that has passed since the previous particle, is sent to the data system and recorded for post-flight analysis. Information about a particle's shape and size is deduced from analysis of the recorded shadow with a variety of pattern recognition algorithms. This figure to the right illustrates (in cartoon form) the image collection system.
Some measurements by the 2D probe in several different types of clouds, ranging from rain drops to pristine ice crystals to more complex heavily rimed ice particles are shown in the figure to the left. The 2D precipitation probe (2D-P) measures in the large hydrometeor size range from 200 mm to 6400 mm.
Data Format and File Naming Conventions Data collected from the FSSP-300 is in ASCII format with a file name that appears as:
Where ddd is the day of the year. A typical file has the following form. Note, the first line of text indicates how many header (comment) lines there on in the file, including blank lines. The remaining comment lines are self explanatory. 35 Comment Lines ... 2D-PSimilar in naming convention, the data for the 2D-P probe is:
with ddd representing the day of the year. Data formats are likewise similar as shown below, with the exception of not having the first line report the number of header lines. There are, however, 34 lines of header data, with actual data appearing on line #35. Video information may be obtained by contacting the GHRC user services office directly either by phone or email using the information provided in the contact information section below. Contact InformationTo order these data or for further information, please contact:
|