| |
NOAA Dual-Beam UV Absorption Ozone Photometer Table of Contents
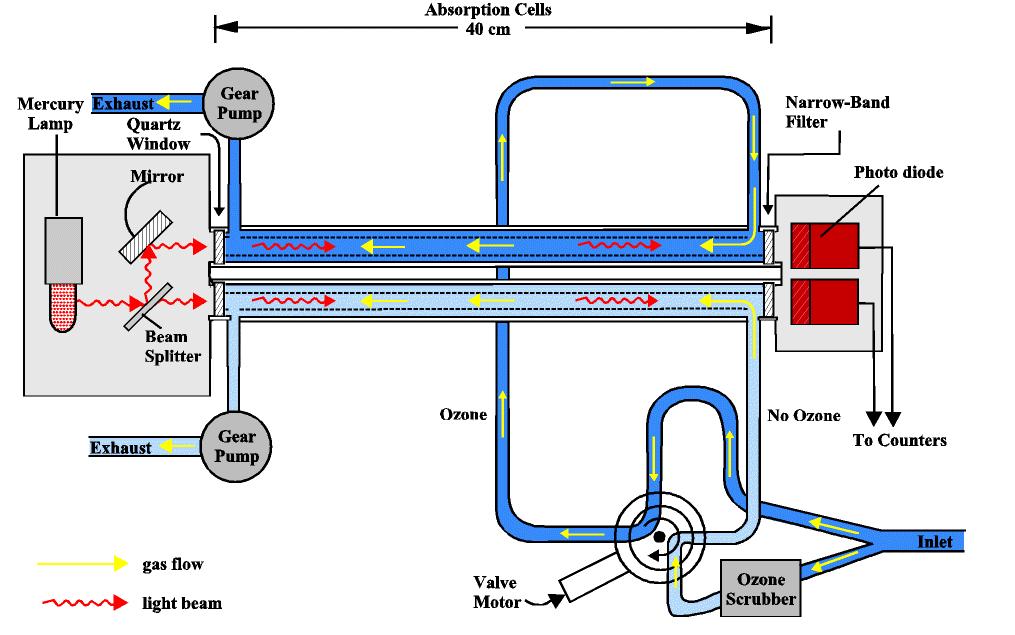
The ER-2 NOAA Dual-Beam UV Absorption Ozone Photometer makes use of the Beer-Lambert law to calculate the ozone number density in the sample chamber. With two identical sampling chambers, there can be a near continuous record made of ozone concentration. Over 300 flights have been logged using this instrument dating back to 1985 in various aircraft: the U-2, ER-2, and WB-57F. Air from outside the aircraft is routed through two paths: one which goes directly to a sampling chamber and the second which passes through an ozone scrubber, then into the second identical sampling chamber. A mercury vapor light source beams light through each of the chambers and then through narrow band filters that passes light of 254 nm. A photo diode immediatly beyond the filter then gives a 'count' which represents the transmissivity of the medium. The cartoon diagram below shows the experimental setup.
At the end of the one second sample time, the valve motor rotates to redirect the sample to the opposite cells so that (in the next scan) the 'ozone' sample would be in the lower cell, the 'no ozone' sample would be in the upper cell. This system provides the ability to cross correllate each cell/counter to the other. Beer-Lambert Law states that the decrease of the radiant intensity traversing a homogeneous absorbing medium is according to a simple exponential function whose argument is the product of the mass absorption cross secion and the path length. Since the only difference in the medium between the two cells is the presence of ozone in one of the cells. Therefore, the difference in absorption is due only to the presence of ozone. The minimum detectable concentration of ozone (one s) is 1.5 x 10^10 molecules/cm^3 (0.6ppbv at STP. Content and structure of the data files Files have the following convention:
where ddd is the day of the year, and fff is the unique ER-2 flight number. As noted in the file name extension, these data are in ASCII format. An example is shown below and is self explanatory. The data begins on line #24: in this example, data from the middle of the dataset has been inserted following the ellipses to show data from altitude.
Proffitt, M. H., and R. J. McLaughlin, Fast-response dual-beam UV absorption ozone photometer suitable for use on stratospheric balloons, Rev. Sci. Instrum., 54, 1719-1728, 1983.Proffitt, M. H. et al., Ozone loss in the Arctic polar vortex inferred from high-altitude aircraft measurements, Nature, 347, 31-36,1990.Proffitt, M. H., et al., Ozone loss inside the northern polar vortex during the 1991-1992 winter, Science, 261, 1150-1154, 1993. Richard, E. C., et al., Severe chemical ozone loss inside the Arctic polar vortex during winter 1999-2000 inferred from in situ airborne measurements, Geophys. Res. Lett., 28, 2197-2200, 2001. To order these data or for further information, please contact:
|