- Aid project partners in emergency management
- Identify areas vulnerable to frequent lightning activity
- Provide partners with a resource to use precipitation patterns as a proxy for lightning strikes
| DATASET NAME | DATA FORMAT | DATA RECIPE | SCIENCE CODE |
|---|---|---|---|
|
HDF-4 netCDF-4 |
|
|
|
|
HDF-4 netCDF-4 |
|||
| netCDF-4 |
|
- |
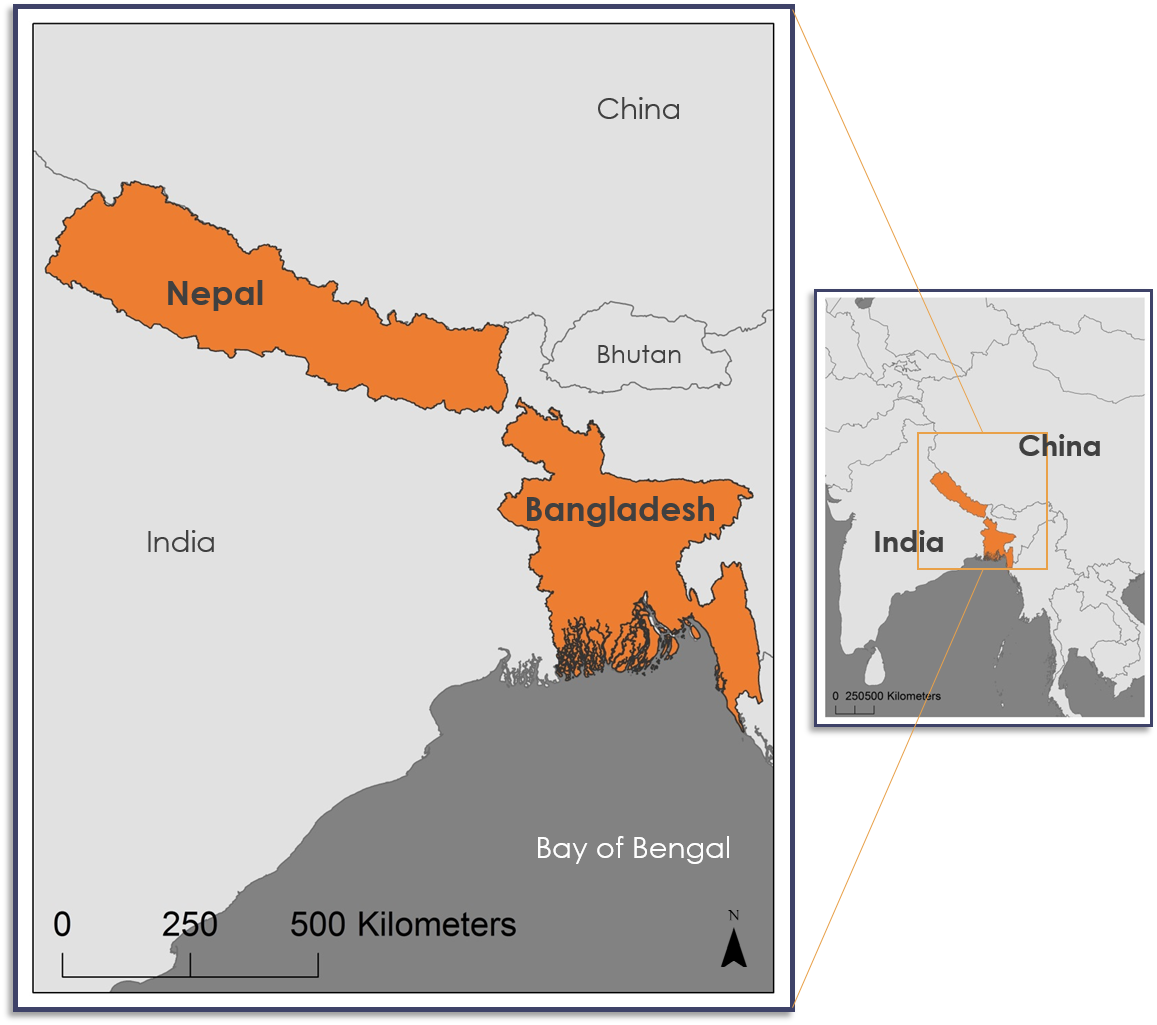
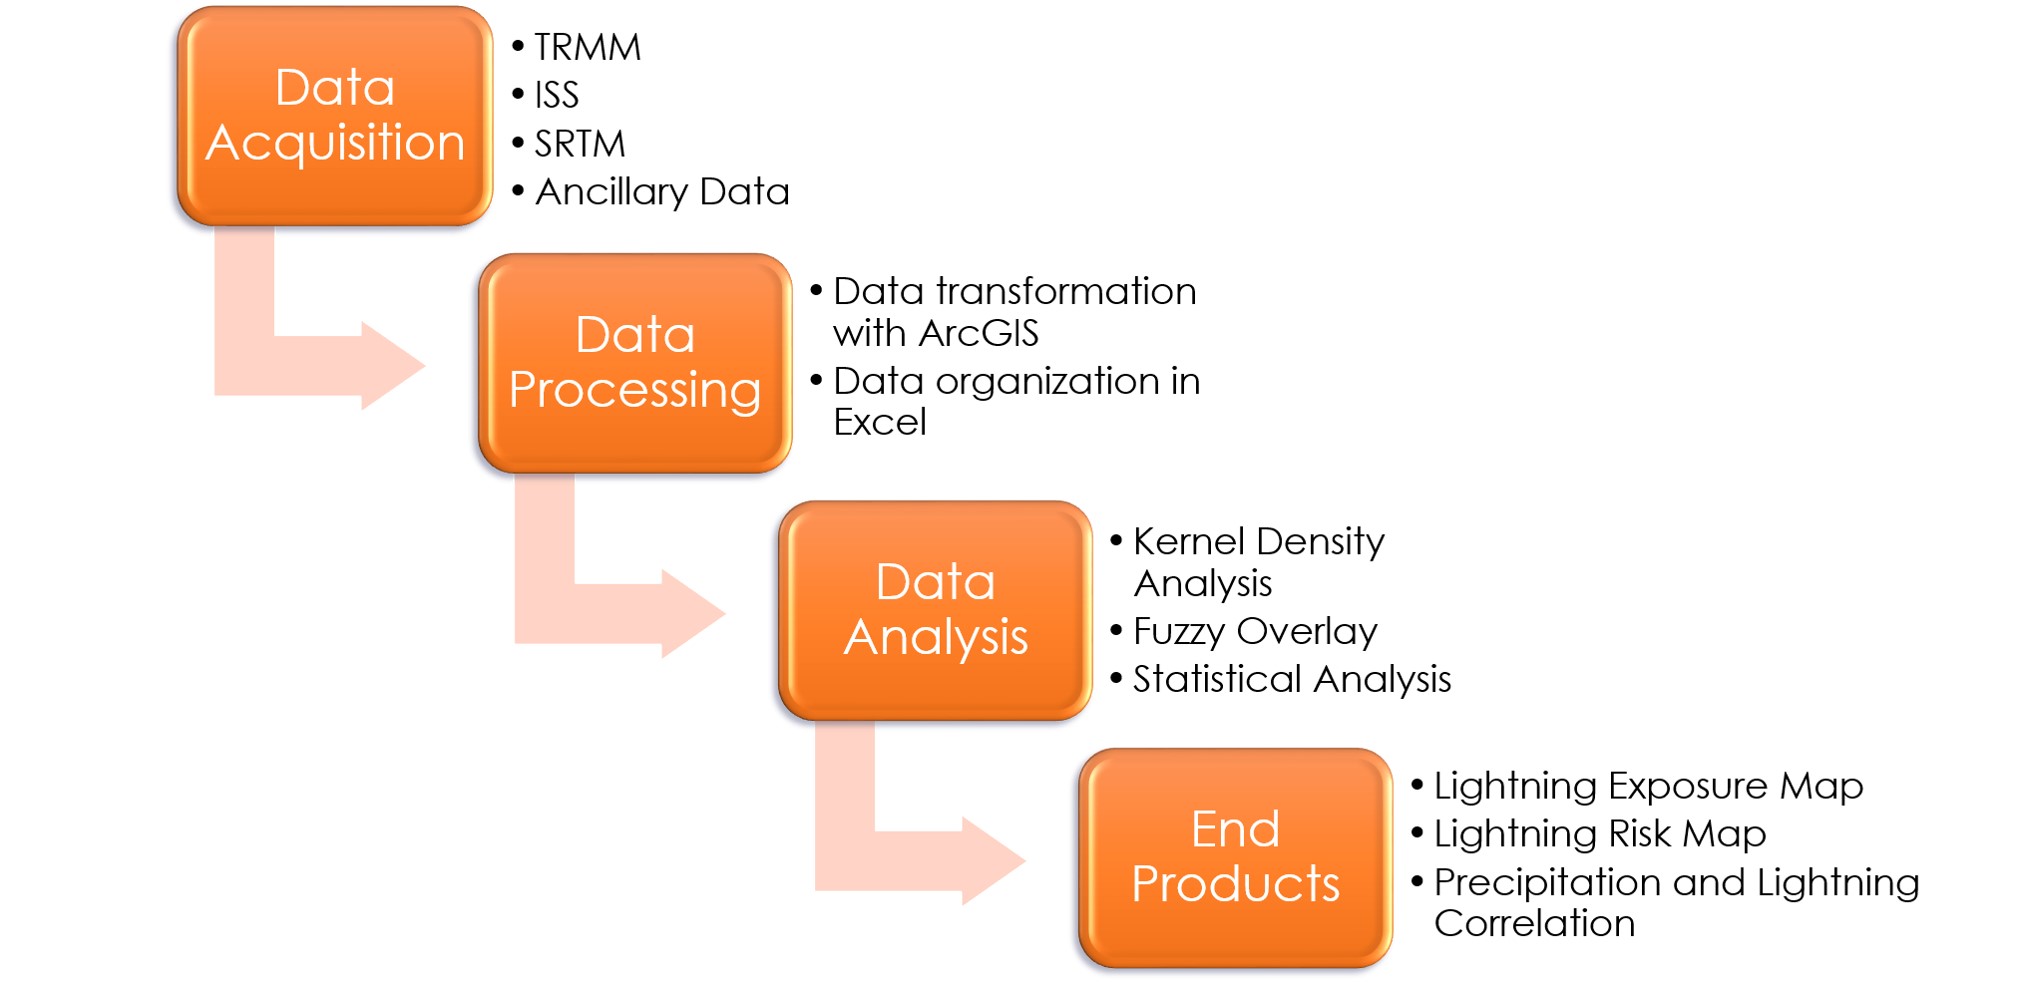 The team created a Lightning Exposure Map (LEM) to highlight areas with the greatest amount of lightning activity. The team obtained TRMM and ISS LIS lightning data from the GHRC DAAC for the years 2001 to 2017, excluding 2015 and 2016 due to an absence of data during that time period. They then plotted the lightning flash locations in Nepal and Bangladesh using ESRI’s ArcGIS. There, the team calculated the magnitude per square kilometer for lightning flashes using the kernel density tool which fits a surface to each point while accounting for the Earth’s curvature, the number of points, and the standard deviation of the points. This information can be used as a guide by emergency managers on where to focus resources and lightning safety efforts.
The team then created the LRM by overlaying lightning exposure, population density, socio-economic conditions, and elevation to determine areas where the most vulnerable populations were exposed to frequent lightning activity. Using the TRMM LIS climatology product, the team discovered that lightning activity decreased rapidly after an elevation of 1,600 meters. From literature review, the team gathered evidence that rural populations are more exposed to lightning activity than urban populations partly due to the larger number of agriculture workers who are vulnerable to lightning-related injury when working outdoors. They also found that available housing provided insufficient lightning safety protection to the population. The team used fuzzy logic analysis, a suitability mapping technique, in ArcGIS to calculate which areas were at the greatest risk based on these contributing parameters. Data from various sources were obtained to perform this analysis including the socio-economic data from the UNISDR GAR15, the population density data from ORNL Landscan 2016 global population dataset, the elevation data from the SRTM, and the lightning exposure data from the LEM.


The LEM indicates that historically lightning occurs most often in the western regions of Nepal and in the Sylhet district of Bangladesh. The team also found that lightning occurrence decreases as elevation increases up the Himalayan Mountains.
The LRM shows high risk areas across northeastern Bangladesh and western Nepal. In Sylhet, a region in northeastern Bangladesh, the large presence of rural agricultural workers, insubstantial rural housing, low elevation, and high lightning density contribute to the high lightning risk in this region. Conversely, despite a high lightning density in Kaski, there is a decrease in risk in western Nepal due to the presence of less rural housing conditions.
The precipitation and lightning correlations were highest March through May, during the pre-monsoon season in Nepal and Bangladesh and were lowest July through September, during the monsoon season. Stronger convective precipitation is present during the pre-monsoon season, which is more conducive to lightning compared to the widespread stratiform rain that is present during the monsoon season. Therefore the seasonal variation in precipitation and lightning correlation values and seasonal variation in precipitation type tend to follow a similar pattern.
- Areas of the greatest lightning occurrence were over the western regions of Nepal and the Sylhet district of Bangladesh
- Areas of the highest lightning risk were over the southern belt of Nepal and northern Bangladesh
- The averaged monthly correlation between lightning and precipitation over the study area was positive
Albrecht, R. I., Goodman, S. J., Buechler, D. E., Blakeslee, R. J., & Christian, H. J. (2016). Where Are the Lightning Hotspots on Earth? Bulletin of the American Meteorological Society, 97(11), 2051-2068. doi: https://doi.org/10.1175/BAMS-D-14-00193.1
Biswas, A., Dalal, K., Hossain, J., Baset, K. U., Rahman, F., & Mashreky, S. R. (2016). Lightning injury is a disaster in Bangladesh? - Exploring its magnitude and public health needs. F1000Research, 6, 5, 2931. doi: https://doi.org/10.12688/f1000research.9537.1
Dewan, A., Hossain, M. F., Rahman, M. M., Yamane, Y., & Holle, R. L. (2017). Recent lightning-related fatalities and injuries in Bangladesh. Weather, Climate, and Society, 9(3), 575-589. doi: https://doi.org/10.1175/WCAS-D-16-0128.1
Houze, R. A., Wilton, D. C., & Smull, B. F. (2007). Monsoon convection in the Himalayan region as seen by the TRMM Precipitation Radar. Quarterly Journal of the Royal Meteorological Society. doi: https://doi.org/10.1002/qj.106
Mäkelä, A., Shrestha, R., & Karki, R. (2014). Thunderstorm characteristics in Nepal during the pre-monsoon season 2012. Atmospheric Research, 137, 91-99. doi: https://doi.org/10.1016/j.atmosres.2013.09.012
Romatschke, U., & Houze, R. A. (2011). Characteristics of precipitating convective systems in the premonsoon season of South Asia. Journal of Hydrometeorology, 12(2), 157-180. doi: https://doi.org/10.1175/2010JHM1311.1

DATE UPDATED
Jun 10th, 2019
AUTHOR(S)
MICRO ARTICLE TYPE
Application