NASA GHRC Collaboration between NASA MSFC and The University of Alabama in Huntsville
  • Access Data
    • Dataset List (HyDRO)
      • View a list of all GHRC dataset holdings using our custom search tool, HyDRO.
    • Search (HyDRO)
      • HyDRO is GHRC's custom dataset search and order tool.

        With HyDRO, you can search, discover, and filter GHRC's dataset holdings.

        HyDRO will also help you find information about browse imagery, access restrictions, and dataset guide documents.
    • NASA Earthdata Search
      • Earthdata is NASA's next generation metadata and service discovery tool, providing search and access capabilities for dataset holdings at all of the Distributed Active Archive Centers (DAACs) including the GHRC.
    • Latest Data (HyDRO)
      • View the latest additions to our data holdings using HyDRO.
  • Measurements
  • Field Campaigns
    • Hurricane Science
      • GHRC has worked with NASA's Hurricane Science Research Program (HSRP) since the 1990's. We are the archive and distribution center for data collected during HSRP field campaigns, as well as the recent Hurricane Science and Severe Storm Sentinel (HS3) Earth Venture mission. Field campaigns provide for intensive observation of specific phenomena using a variety of instruments on aircraft, satellites and surface networks.

        GHRC also hosts a database of Atlantic and Pacific tropical storm tracks derived from the storm data published by the National Hurricane Center (NHC).
    • HS3 (2012-14)
      • Hurricane and Severe Storm Sentinel (HS3) is an Earth Ventures – Suborbital 1 mission aimed at better understanding the physical processes that control hurricane intensity change, addressing questions related to the roles of environmental conditions and internal storm structures to storm intensification.

        A variety of in-situ, satellite observations, airborne data, meteorological analyses, and simulation data were collected with missions over the Atlantic in August and September of three observation years (2012, 2013, 2014). These data are available at GHRC beginning in 2015.
    • GRIP (2010)
      • The Genesis and Rapid Intensification Processes (GRIP) experiment was a NASA Earth science field experiment in 2010 that was conducted to better understand how tropical storms form and develop into major hurricanes.

        The GRIP deployment was 15 August – 30 September 2010 with bases in Ft. Lauderdale, FL for the DC-8, at Houston, TX for the WB-57, and at NASA Dryden Flight Research Facility, CA for the Global Hawk.
    • TC4 (2007)
      • The NASA TC4 (Tropical Composition, Cloud and Climate Coupling) mission investigated the structure and properties of the chemical, dynamic, and physical processes in atmosphere of the tropical Eastern Pacific.

        TC4 was based in San Jose, Costa Rica during July 2007.

        The Real Time Mission Monitor provided simultaneous aircraft status for three aircraft during the TC4 experiment. During TC4, the NASA ER-2, WB-57 and DC-8 aircraft flew missions at various times. The science flights were scheduled between 17 July and 8 August 2007.
    • NAMMA (2006)
      • The NASA African Monsoon Multidisciplinary Analyses (NAMMA) campaign was a field research investigation based in the Cape Verde Islands, 350 miles off the coast of Senegal in west Africa.

        Commenced in August 2006, NASA scientists employed surface observation networks and aircraft to characterize the evolution and structure of African Easterly Waves (AEWs) and Mesoscale Convective Systems over continental western Africa, and their associated impacts on regional water and energy budgets.
    • TCSP (2005)
      • The Tropical Cloud Systems and Processes (TCSP) mission was an Earth science field research investigation focused on the study of the dynamics and thermodynamics of precipitating cloud systems and tropical cyclones. TCSP was conducted during the period July 1-27, 2005 out of the Juan Santamaria Airfield in San Jose, Costa Rica.

        The TCSP field experiment flew 12 NASA ER-2 science flights, including missions to Hurricanes Dennis and Emily, Tropical Storm Gert and an eastern Pacific mesoscale complex that may possibly have further developed into Tropical Storm Eugene.
    • ACES (2002)
      • The Altus Cumulus Electrification Study (ACES) was aimed at better understanding the causes and effects of electrical storms.

        Based at the Naval Air Station Key West in Florida, researchers in August 2002 chased down thunderstorms using an uninhabited aerial vehicle, or "UAV", allowing them to achieve dual goals of gathering weather data safely and testing new aircraft technology. This marked the first time a UAV was used to conduct lightning research.
    • CAMEX-4 (2001)
      • The Convection And Moisture EXperiment (CAMEX) was a series of NASA-sponsored hurricane science field research investigations. The fourth field campaign in the CAMEX series (CAMEX-4) was held in 16 August - 24 September, 2001 and was based out of Jacksonville Naval Air Station, Florida.

        CAMEX-4 was focused on the study of tropical cyclone (hurricane) development, tracking, intensification, and landfalling impacts using NASA-funded aircraft and surface remote sensing instrumentation.
    • CAMEX-3 (1998)
      • The Convection And Moisture EXperiment (CAMEX) is a series of hurricane science field research investigations sponsored by NASA. The third field campaign in the CAMEX series (CAMEX-3) was based at Patrick Air Force Base, Florida from 6 August - 23 September, 1998.

        CAMEX-3 successfully studied Hurricanes Bonnie, Danielle, Earl and Georges, yielding data on hurricane structure, dynamics, and motion. CAMEX-3 collected data for research in tropical cyclone development, tracking, intensification, and landfalling impacts using NASA-funded aircraft and surface remote sensing instrumentation.
    • GPM Ground Validation
      • The NASA Global Precipitation Measurement Mission (GPM) Ground Validation (GV) program includes the following field campaigns:

        a) LPVEx, Gulf of Finland in autumn 2010, to study rainfall in high latitude environments

        b) MC3E, cental Oklahoma spring and early summer 2011, to develop a complete characterization of convective cloud systems, precipitation and the environment

        c) GCPEx, Ontario, Canada winter of 2011-2012, direct and remove sensing observations, and coordinated model simulations of precipitating snow.

        d) IFloodS, Iowa, spring and early summer 2013, to study the relative roles of rainfall quantities and other factors in flood genesis.

        e) IPHEx, N. Carolina Appalachians/Piedmont region May-June 2014, for hydrologic validation over varied topography.

        f) OLYMPEx, Washington's Olympic Peninsula scheduled November 2015-February 2016, for hydrologic validation in extreme coastal and topographic gradients
    • OLYMPEX (Upcoming)
      • The OLYMPEX field campaign is scheduled to take place between November, 2015, and February, 2016, on the Olympic Peninsula in the Pacific Northwest of the United States.

        This field campaign will provide ground-based validation support of the Global Precipitation Measurement (GPM) satellite program that is a joint effort between NASA and JAXA.

        As for all GPM-GV campaigns, the GHRC will provide a collaboration portal to help investigators exchange planning information and to support collection of real-time data as well as mission science, project and instrument status reports during the campaign.
    • IPHEx (2014)
      • The Integrated Precipitation and Hydrology Experiment (IPHEx) was conducted in North Carolina during the months of April-June, 2014.

        IPHEx sought to characterize warm season orographic precipitation regimes, and the relationship between precipitation regimes and hydrologic processes in regions of complex terrain.
    • IFLOODs (2013)
      • The Iowa Flood Studies (IFloodS) experiment was conducted in the central to northeastern part of Iowa in Midwestern United States during the months of April-June, 2013.

        IFloodS' primary goal was to discern the relative roles of rainfall quantities such as rate and accumulation as compared to other factors (e.g. transport of water in the drainage network) in flood genesis.
    • GCPEX (2011-2012)
      • The GPM Cold-season Precipitation Experiment (GCPEx) occurred in Ontario, Canada during the winter season (Jan 15- Feb 26) of 2011-2012.

        GCPEx addressed shortcomings in GPM snowfall retrieval algorithm by collecting microphysical properties, associated remote sensing observations, and coordinated model simulations of precipitating snow. Collectively the GCPEx data set provides a high quality, physically-consistent and coherent data set suited to the development and testing of GPM snowfall retrieval algorithm physics.
    • MC3E (2011)
      • The Mid-latitude Continental Convective Clouds Experiment (MC3E) took place in central Oklahoma during the April–June 2011 period.

        The overarching goal was to provide the most complete characterization of convective cloud systems, precipitation, and the environment that has ever been obtained, providing constraints for model cumulus parameterizations and space-based rainfall retrieval algorithms over land that had never before been available.
    • LPVEx (2010)
      • The Light Precipitation Evaluation Experiment (LPVEx) took place in the Gulf of Finland in September and October, 2010 and collected microphysical properties, associated remote sensing observations, and coordinated model simulations of high latitude precipitation systems to drive the evaluation and development of precipitation algorithms for current and future satellite platforms.

        In doing so, LPVEx sought to address the general lack of dedicated ground-validation datasets from the ongoing development of new or improved algorithms for detecting and quantifying high latitude rainfall
  • Projects
    • HS3 Suborbital Mission
      • Hurricane and Severe Storm Sentinel (HS3) is an Earth Ventures – Suborbital 1 mission aimed at better understanding the physical processes that control hurricane intensity change, addressing questions related to the roles of environmental conditions and internal storm structures to storm intensification.
    • DISCOVER - MEaSUREs
      • DISCOVER was funded by NASA’s MEaSUREs program to provide highly accurate, multi-decadal geophysical products derived from satellite microwave sensors.
    • LIS Mission
      • Lightning observations from the Lightning Imaging Sensors (LIS) aboard the NASA’s TRMM satellite and International Space Station, as well as airborne observations and ground validation data.
    • SANDS
      • The SANDS project addressed Gulf of Mexico Alliance priority issues by generating enhanced imagery from MODIS and Landsat data to identify suspended sediment resulting from tropical cyclones. These tropical cyclones have significantly altered normal coastal processes and characteristics in the Gulf region through sediment disturbance.
    • LANCE AMSR2
      • The Land, Atmosphere Near real-time Capability for EOS (LANCE) system provides access to near real-time data (less than 3 hours from observation) from AIRS, AMSR2, MLS, MODIS, and OMI instruments. LANCE AMSR2 products are generated by the AMSR Science Investigator-led Processing System at the GHRC.
  • Resources
    • Tools & Technologies
      • A collection of tools & technologies developed and/or used by GHRC.
    • Publications
      • View GHRC & ITSC publications on the ITSC website
    • Innovations Lab
      • The GHRC Innovations Lab is a showcase for emerging geoinformatics technologies resulting from NASA-sponsored research at the University of Alabama in Huntsville.
    • Educational Resources
      • A list of resources from NASA, MSFC, and other sources for teachers and students focused on global change, hydrology, and science education.
    • Referencing our data
      • GHRC dataset citation help and examples.
    • Documents
      • Documentation related to GHRC datasets, software, and other offerings.
    • Glossary
      • Terms and their definitions
    • Featured items
      • The latest tools from GHRC.
  • Multimedia
  • About
    • Welcome
      • Local resources, lodging information, and weather to help you plan your visit to GHRC.
    • GHRC Personnel
      • A list to help you keep in touch with our personnel
    • FAQ
      • Frequently Asked Questions about GHRC data and services, and their answers.
    • Data Citations and Acknowledgements
      • GHRC dataset citation help and examples
  • Cite Us
  • Contact Us
feedback
DOCUMENTATION

Documentation

Guide Documents

Dataset PI Documents

Dataset Software

CAMEX-3 Cloud and Aerosol Particle Characterization (CAPAC) and CAPAC Video (CAPACV)

Table of Contents

Introduction
Instrument Description and Operating Principles
FSSP-300
2D-P
Data Format and File Naming Conventions
FSSP-300
2D-P
Contact Information

Introduction

CAPAC is a series of three instruments. The first is the Forward Scattering Spectrometer Probe model 300 (FSSP-300), the Two Dimensional Optical Array Probes [Cloud and Precipitation Probes (2D-P)] and the CAPAC video. These instruments flew during CAMEX-3 upon the NASA DC-8 mounted on the left wing.

The FSSP 300 is an instrument developed by Particle Measuring Systems (PMS Inc., Boulder, Co) for the measurement of aerosol particle size distributions. The sensor was originally developed for the study of stratospheric aerosol distributions and polar stratospheric clouds but is now widely utilized in studies of tropospheric chemistry and aerosol physics.

The two dimensional probes 2D-P, are instruments developed by Particle Measuring Systems (PMS Inc., Boulder, Co) for the measurement of cloud and precipitation drop size distributions. These sensors are used primarily for the study of cloud microphysical processes, particularly the growth of cloud drops and ice crystals through aggregation, riming and coalescence into drizzle, rain drops, graupel or other forms of precipitation.

CAPAC videos are a visual record of the particles and hydrometeors passing through the instrument housing.

Instrument Description and Operating Principles

FSSP-300

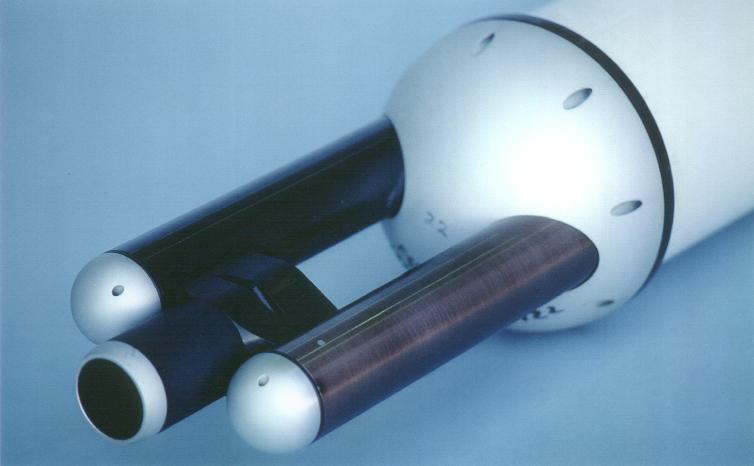
The FSSP-300 is of that general class of instruments called optical particle counters (OPCs) that detect single particles and size them by measuring the intensity of light that the particle scatters when passing through a light beam.

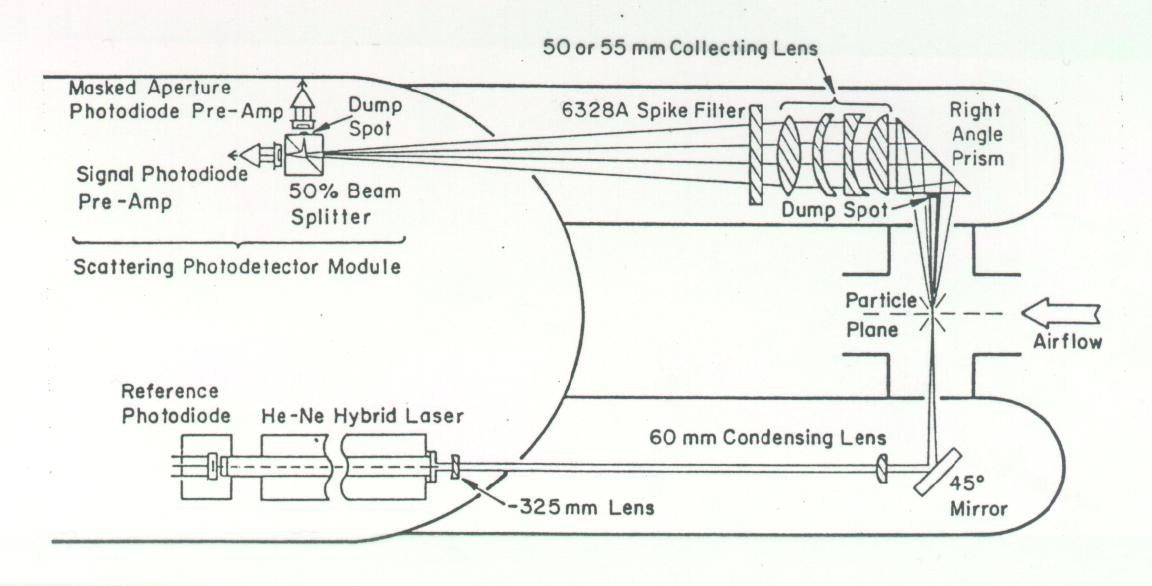
The schematic diagram shown above illustrates the optical path of this instrument.

A Helium Neon laser beam is focused to a small diameter at the center of an inlet that faces into the oncoming airstream. This laser beam is blocked on the opposite side of the inlet with an optical stop, a "dump spot" to prevent the beam from entering the collection optics. Particles that encounter this beam scatter light in all directions and some of that scattered in the forward direction is directed by a right angle prism though a condensing lens and onto a beam splitter. The "dump spot" on the prism and aperture of the condensing lens define a collection angle from about 4o - 12o.

The beam splitter divides the scattered light into two components, each of which impinge on a photodetector. One of these detectors, however, is optically masked to receive only scattered light when the particles pass through the laser beam within a region 0.5 mm either side of the center of focus. Particles that fall outside that region are rejected when the signal from the unmasked detector exceeds that from the masked detector. This defines the sample volume that is needed in order to calculate particle concentrations.

The size of the particle is determined by measuring the light scattering intensity and using Mie scattering theory to relate this intensity to the particle size. The size that is determined by the FSSP assumes that the scattered light detected is from a spherical particle of refractive index 1.58. The size distributions produced from these measurements must be viewed with great caution when in mixed composition aerosols. Particles will not be correctly sized due to their different refractive index and non-spherical shapes.

Once measured, the particle size is categorized into one of 31 channels (bins) and this information is sent to the data system where the number of particles in each channel is accumulated over a preselected time period. Particles in sizes from 0.42x10⁻³cm to 23.67x10⁻³cm are measured. See the table in the data section below for actual bin size limits, and an example of data.

FSSP-300 is contained in a canister that is mounted on an aircraft pylon below the left wing projecting into the free air stream.


2D-P

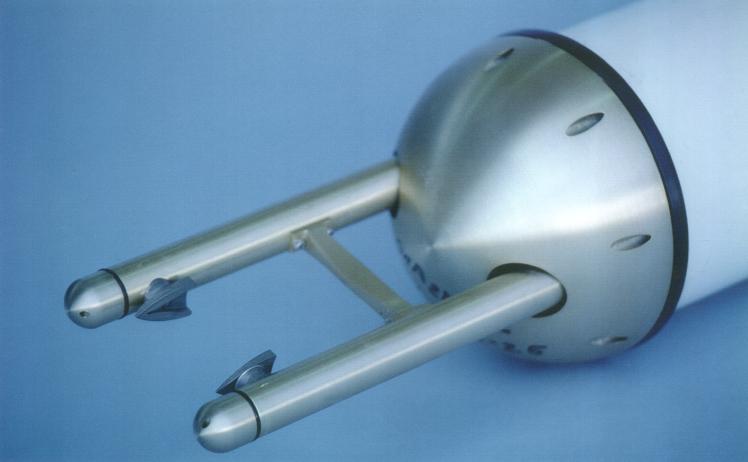
The 2DP record the two dimensional shadows of hydrometeors as they pass through a focussed He-Ne laser beam as shown in the adjacent diagram. The shadow is cast onto a linear diode array and the on/off state of these diodes is stored during the particle's passage through the laser beam. This information, along with the time that has passed since the previous particle, is sent to the data system and recorded for post-flight analysis.

Information about a particle's shape and size is deduced from analysis of the recorded shadow with a variety of pattern recognition algorithms. This figure to the right illustrates (in cartoon form) the image collection system.


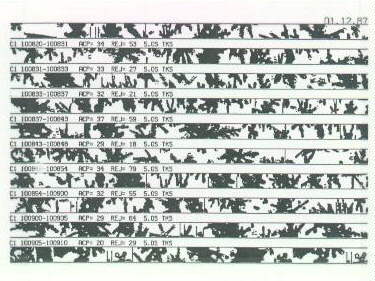
Some measurements by the 2D probe in several different types of clouds, ranging from rain drops to pristine ice crystals to more complex heavily rimed ice particles are shown in the figure to the left. The 2D precipitation probe (2D-P) measures in the large hydrometeor size range from 200 mm to 6400 mm.


Data Format and File Naming Conventions

FSSP-300

Data collected from the FSSP-300 is in ASCII format with a file name that appears as:

98ddd_CAPAC_FSSP-300.txt

Where ddd is the day of the year. A typical file has the following form. Note, the first line of text indicates how many header (comment) lines there on in the file, including blank lines. The remaining comment lines are self explanatory.

35 Comment Lines
FSSP-300 Aerosol Particle Data from DC-8
1998 08 21     Flight Date 
5     CAMEX-3 Science Flight Number
98-04-08      DC-8 Flight Number
1999 04 18      Data Reduction Date 
Pueschel, Rudolf, NASA Ames, Principal Investigator 
Instrument was calibrated using latex spheres (refractive index 1.59).
Warning:  Occasionally, measurements in a particular size bin may be too high.
Size distributions should be examined before the data are used.
Total particle surface area and total particle volume are calculated using maximum number of particle size intervals available.
Bad data are denoted by 9.9E+9s
18 Columns of data
Col. 1 Time in hours:minutes:seconds UTC seconds
Col. 2 Time in UT seconds
Col. 3 Concentration for particle diameters 0.42 - 0.47 (# cm-3)
Col. 4 Concentration for particle diameters 0.47 - 0.51 (# cm-3)
Col. 5 Concentration for particle diameters 0.51 - 0.55 (# cm-3)
Col. 6 Concentration for particle diameters 0.55 - 0.60 (# cm-3)
Col. 7 Concentration for particle diameters 0.60 - 0.65 (# cm-3)
Col. 8 Concentration for particle diameters 0.65 - 0.70 (# cm-3)
Col. 9 Concentration for particle diameters 0.70 - 0.89 (# cm-3)
Col. 10 Concentration for particle diameters 0.89 - 1.08 (# cm-3)
Col. 11 Concentration for particle diameters 1.08 - 3.97 (# cm-3)
Col. 12 Concentration for particle diameters 3.97 - 6.88 (# cm-3)
Col. 13 Concentration for particle diameters 6.88 - 9.78 (# cm-3)
Col. 14 Concentration for particle diameters 9.78 - 13.53 (# cm-3)
Col. 15 Concentration for particle diameters 13.53 - 23.67 (# cm-3)
Col. 16 Total particle concentration, total spectrum (# cm-3)
Col. 17 Total particle surface area, total spectrum (um2 cm-3)
Col. 18 Total particle volume, total spectrum (um2 cm-3)
.
.
.
17:28:00  62880 8.8E-1 8.2E-1 1.2E+0 7.6E-1 2.1E-1 7.9E-1 2.2E+0 1.5E-1 2.0E+0 7.9E-1  .0E+0  .0E+0  .0E+0 9.9E+0 8.5E+1 5.6E+1
17:29:00  62940 3.2E-1 9.0E-1 8.4E-1 3.2E-1 7.9E-2 1.0E-1 8.2E-1 3.4E-1 1.3E+0 3.0E-1 4.6E-2  .0E+0  .0E+0 5.4E+0 4.2E+1 2.9E+1
17:30:00  63000 1.8E+0 9.4E-1 1.3E+0 7.5E-1 2.2E-1 8.8E-1 2.9E+0 3.9E-1 5.3E-1 4.8E-1  .0E+0  .0E+0  .0E+0 1.0E+1 5.3E+1 3.7E+1
17:31:00  63060 1.1E+0 1.3E+0 9.2E-1 7.1E-1 3.4E-1 2.4E-1 2.7E+0 3.1E-1 8.4E-1 6.2E-1  .0E+0  .0E+0 4.0E-2 9.1E+0 8.2E+1 8.7E+1

...

2D-P

Similar in naming convention, the data for the 2D-P probe is:

98ddd_CAPAC_2d.txt

with ddd representing the day of the year. Data formats are likewise similar as shown below, with the exception of not having the first line report the number of header lines. There are, however, 34 lines of header data, with actual data appearing on line #35.
35 Comment Lines
OAP-2D-C Aerosol Particle Data from DC-8
1998 09 02     Flight Date
11     CAMEX-3 Science Flight Number
98-04-14      DC-8 Flight Number
1999 04 18      Data Reduction Date
Pueschel, Rudolf, NASA Ames, Principal Investigator
Instrument was calibrated using latex spheres (refractive index 1.59).
Warning:  Occasionally, measurements in a particular size bin may be too high.
Size distributions should be examined before the data are used.
Total particle surface area and total particle volume are calculated using
       maximum number of particle size intervals available.
Bad data are denoted by 9.9E+9s
18 Columns of data
Col. 1 Time in hours:minutes:seconds UTC seconds<
Col. 2 Time in UT seconds
Col. 3 Concentration for particle diameters 17.75 - 42.50 (# cm-3)
Col. 4 Concentration for particle diameters 42.50 - 67.75 (# cm-3)
Col. 5 Concentration for particle diameters 67.75 - 92.00 (# cm-3)
Col. 6 Concentration for particle diameters 92.00 - 116.75 (# cm-3)
Col. 7 Concentration for particle diameters 116.75 - 166.00 (# cm-3)
Col. 8 Concentration for particle diameters 166.00 - 215.25 (# cm-3)
Col. 9 Concentration for particle diameters 215.25 - 289.00 (# cm-3)
Col. 10 Concentration for particle diameters 289.00 - 412.50 (# cm-3)
Col. 11 Concentration for particle diameters 412.50 - 562.50 (# cm-3)
Col. 12 Concentration for particle diameters 562.50 - 762.50 (# cm-3)
Col. 13 Total particle concentration, total spectrum (# cm-3)
Col. 14 Total particle surface area, total spectrum (um2 cm-3)
Col. 15 Total particle volume, total spectrum (um2 cm-3)
.
.
.
20:00:00   72000 2.09E-01 5.69E-02 1.91E-02 1.05E-02 8.11E-03 2.43E-03 1.13E-03 5.40E-04 6.45E-04 1.31E-05 3.09E-01 1.45E+04 8.87E+05
20:01:00   72060 7.15E-02 1.93E-02 7.19E-03 4.57E-03 4.17E-03 1.56E-03 8.44E-04 3.33E-04 2.68E-04 1.14E-10 1.10E-01 6.51E+03 4.23E+05
20:02:00   72120 1.25E-03 2.15E-04 7.63E-05 4.41E-05 6.06E-05 1.57E-05 9.84E-06 2.70E-06 8.34E-07 9.38E-12 1.68E-03 6.97E+01 3.31E+03
20:03:00   72180 8.48E-03 1.64E-03 5.49E-04 2.84E-04 2.69E-04 1.19E-04 4.69E-05 9.12E-06 1.00E-06 1.75E-36 1.14E-02 4.12E+02 1.59E+04
20:04:00   72240 2.36E-02 6.78E-03 2.25E-03 1.58E-03 1.91E-03 9.20E-04 5.75E-04 5.19E-04 2.30E-04 9.19E-05 3.84E-02 4.17E+03 4.04E+05
20:05:00   72300 2.46E-02 6.93E-03 2.80E-03 1.86E-03 2.10E-03 6.85E-04 3.63E-04 8.99E-05 1.25E-05 1.47E-12 3.94E-02 2.27E+03 1.08E+05

Video information may be obtained by contacting the GHRC user services office directly either by phone or email using the information provided in the contact information section below.

Contact Information

To order these data or for further information, please contact:

Global Hydrology Resource Center
User Services
320 Sparkman Drive
Huntsville, AL 35805
Phone: 256-961-7932
E-mail: support-ghrc@earthdata.nasa.gov
Web: http://ghrc.nsstc.nasa.gov/


ITSC

UAH

RSS feed GHRC Facebook GHRC Twitter

NASA Official:
Manil Maskey

Website maintained by the
UAH ITSC Web Team

If you have trouble viewing or
navigating this page, please contact
GHRC User Services

NASA Web Privacy Policy and Important Notices


    The GHRC is a member of the ICSU World Data System