NASA GHRC Collaboration between NASA MSFC and The University of Alabama in Huntsville
  • Access Data
    • Dataset List (HyDRO)
      • View a list of all GHRC dataset holdings using our custom search tool, HyDRO.
    • Search (HyDRO)
      • HyDRO is GHRC's custom dataset search and order tool.

        With HyDRO, you can search, discover, and filter GHRC's dataset holdings.

        HyDRO will also help you find information about browse imagery, access restrictions, and dataset guide documents.
    • NASA Earthdata Search
      • Earthdata is NASA's next generation metadata and service discovery tool, providing search and access capabilities for dataset holdings at all of the Distributed Active Archive Centers (DAACs) including the GHRC.
    • Latest Data (HyDRO)
      • View the latest additions to our data holdings using HyDRO.
  • Measurements
  • Field Campaigns
    • Hurricane Science
      • GHRC has worked with NASA's Hurricane Science Research Program (HSRP) since the 1990's. We are the archive and distribution center for data collected during HSRP field campaigns, as well as the recent Hurricane Science and Severe Storm Sentinel (HS3) Earth Venture mission. Field campaigns provide for intensive observation of specific phenomena using a variety of instruments on aircraft, satellites and surface networks.

        GHRC also hosts a database of Atlantic and Pacific tropical storm tracks derived from the storm data published by the National Hurricane Center (NHC).
    • HS3 (2012-14)
      • Hurricane and Severe Storm Sentinel (HS3) is an Earth Ventures – Suborbital 1 mission aimed at better understanding the physical processes that control hurricane intensity change, addressing questions related to the roles of environmental conditions and internal storm structures to storm intensification.

        A variety of in-situ, satellite observations, airborne data, meteorological analyses, and simulation data were collected with missions over the Atlantic in August and September of three observation years (2012, 2013, 2014). These data are available at GHRC beginning in 2015.
    • GRIP (2010)
      • The Genesis and Rapid Intensification Processes (GRIP) experiment was a NASA Earth science field experiment in 2010 that was conducted to better understand how tropical storms form and develop into major hurricanes.

        The GRIP deployment was 15 August – 30 September 2010 with bases in Ft. Lauderdale, FL for the DC-8, at Houston, TX for the WB-57, and at NASA Dryden Flight Research Facility, CA for the Global Hawk.
    • TC4 (2007)
      • The NASA TC4 (Tropical Composition, Cloud and Climate Coupling) mission investigated the structure and properties of the chemical, dynamic, and physical processes in atmosphere of the tropical Eastern Pacific.

        TC4 was based in San Jose, Costa Rica during July 2007.

        The Real Time Mission Monitor provided simultaneous aircraft status for three aircraft during the TC4 experiment. During TC4, the NASA ER-2, WB-57 and DC-8 aircraft flew missions at various times. The science flights were scheduled between 17 July and 8 August 2007.
    • NAMMA (2006)
      • The NASA African Monsoon Multidisciplinary Analyses (NAMMA) campaign was a field research investigation based in the Cape Verde Islands, 350 miles off the coast of Senegal in west Africa.

        Commenced in August 2006, NASA scientists employed surface observation networks and aircraft to characterize the evolution and structure of African Easterly Waves (AEWs) and Mesoscale Convective Systems over continental western Africa, and their associated impacts on regional water and energy budgets.
    • TCSP (2005)
      • The Tropical Cloud Systems and Processes (TCSP) mission was an Earth science field research investigation focused on the study of the dynamics and thermodynamics of precipitating cloud systems and tropical cyclones. TCSP was conducted during the period July 1-27, 2005 out of the Juan Santamaria Airfield in San Jose, Costa Rica.

        The TCSP field experiment flew 12 NASA ER-2 science flights, including missions to Hurricanes Dennis and Emily, Tropical Storm Gert and an eastern Pacific mesoscale complex that may possibly have further developed into Tropical Storm Eugene.
    • ACES (2002)
      • The Altus Cumulus Electrification Study (ACES) was aimed at better understanding the causes and effects of electrical storms.

        Based at the Naval Air Station Key West in Florida, researchers in August 2002 chased down thunderstorms using an uninhabited aerial vehicle, or "UAV", allowing them to achieve dual goals of gathering weather data safely and testing new aircraft technology. This marked the first time a UAV was used to conduct lightning research.
    • CAMEX-4 (2001)
      • The Convection And Moisture EXperiment (CAMEX) was a series of NASA-sponsored hurricane science field research investigations. The fourth field campaign in the CAMEX series (CAMEX-4) was held in 16 August - 24 September, 2001 and was based out of Jacksonville Naval Air Station, Florida.

        CAMEX-4 was focused on the study of tropical cyclone (hurricane) development, tracking, intensification, and landfalling impacts using NASA-funded aircraft and surface remote sensing instrumentation.
    • CAMEX-3 (1998)
      • The Convection And Moisture EXperiment (CAMEX) is a series of hurricane science field research investigations sponsored by NASA. The third field campaign in the CAMEX series (CAMEX-3) was based at Patrick Air Force Base, Florida from 6 August - 23 September, 1998.

        CAMEX-3 successfully studied Hurricanes Bonnie, Danielle, Earl and Georges, yielding data on hurricane structure, dynamics, and motion. CAMEX-3 collected data for research in tropical cyclone development, tracking, intensification, and landfalling impacts using NASA-funded aircraft and surface remote sensing instrumentation.
    • GPM Ground Validation
      • The NASA Global Precipitation Measurement Mission (GPM) Ground Validation (GV) program includes the following field campaigns:

        a) LPVEx, Gulf of Finland in autumn 2010, to study rainfall in high latitude environments

        b) MC3E, cental Oklahoma spring and early summer 2011, to develop a complete characterization of convective cloud systems, precipitation and the environment

        c) GCPEx, Ontario, Canada winter of 2011-2012, direct and remove sensing observations, and coordinated model simulations of precipitating snow.

        d) IFloodS, Iowa, spring and early summer 2013, to study the relative roles of rainfall quantities and other factors in flood genesis.

        e) IPHEx, N. Carolina Appalachians/Piedmont region May-June 2014, for hydrologic validation over varied topography.

        f) OLYMPEx, Washington's Olympic Peninsula scheduled November 2015-February 2016, for hydrologic validation in extreme coastal and topographic gradients
    • OLYMPEX (Upcoming)
      • The OLYMPEX field campaign is scheduled to take place between November, 2015, and February, 2016, on the Olympic Peninsula in the Pacific Northwest of the United States.

        This field campaign will provide ground-based validation support of the Global Precipitation Measurement (GPM) satellite program that is a joint effort between NASA and JAXA.

        As for all GPM-GV campaigns, the GHRC will provide a collaboration portal to help investigators exchange planning information and to support collection of real-time data as well as mission science, project and instrument status reports during the campaign.
    • IPHEx (2014)
      • The Integrated Precipitation and Hydrology Experiment (IPHEx) was conducted in North Carolina during the months of April-June, 2014.

        IPHEx sought to characterize warm season orographic precipitation regimes, and the relationship between precipitation regimes and hydrologic processes in regions of complex terrain.
    • IFLOODs (2013)
      • The Iowa Flood Studies (IFloodS) experiment was conducted in the central to northeastern part of Iowa in Midwestern United States during the months of April-June, 2013.

        IFloodS' primary goal was to discern the relative roles of rainfall quantities such as rate and accumulation as compared to other factors (e.g. transport of water in the drainage network) in flood genesis.
    • GCPEX (2011-2012)
      • The GPM Cold-season Precipitation Experiment (GCPEx) occurred in Ontario, Canada during the winter season (Jan 15- Feb 26) of 2011-2012.

        GCPEx addressed shortcomings in GPM snowfall retrieval algorithm by collecting microphysical properties, associated remote sensing observations, and coordinated model simulations of precipitating snow. Collectively the GCPEx data set provides a high quality, physically-consistent and coherent data set suited to the development and testing of GPM snowfall retrieval algorithm physics.
    • MC3E (2011)
      • The Mid-latitude Continental Convective Clouds Experiment (MC3E) took place in central Oklahoma during the April–June 2011 period.

        The overarching goal was to provide the most complete characterization of convective cloud systems, precipitation, and the environment that has ever been obtained, providing constraints for model cumulus parameterizations and space-based rainfall retrieval algorithms over land that had never before been available.
    • LPVEx (2010)
      • The Light Precipitation Evaluation Experiment (LPVEx) took place in the Gulf of Finland in September and October, 2010 and collected microphysical properties, associated remote sensing observations, and coordinated model simulations of high latitude precipitation systems to drive the evaluation and development of precipitation algorithms for current and future satellite platforms.

        In doing so, LPVEx sought to address the general lack of dedicated ground-validation datasets from the ongoing development of new or improved algorithms for detecting and quantifying high latitude rainfall
  • Projects
    • HS3 Suborbital Mission
      • Hurricane and Severe Storm Sentinel (HS3) is an Earth Ventures – Suborbital 1 mission aimed at better understanding the physical processes that control hurricane intensity change, addressing questions related to the roles of environmental conditions and internal storm structures to storm intensification.
    • DISCOVER - MEaSUREs
      • DISCOVER was funded by NASA’s MEaSUREs program to provide highly accurate, multi-decadal geophysical products derived from satellite microwave sensors.
    • LIS Mission
      • Lightning observations from the Lightning Imaging Sensors (LIS) aboard the NASA’s TRMM satellite and International Space Station, as well as airborne observations and ground validation data.
    • SANDS
      • The SANDS project addressed Gulf of Mexico Alliance priority issues by generating enhanced imagery from MODIS and Landsat data to identify suspended sediment resulting from tropical cyclones. These tropical cyclones have significantly altered normal coastal processes and characteristics in the Gulf region through sediment disturbance.
    • LANCE AMSR2
      • The Land, Atmosphere Near real-time Capability for EOS (LANCE) system provides access to near real-time data (less than 3 hours from observation) from AIRS, AMSR2, MLS, MODIS, and OMI instruments. LANCE AMSR2 products are generated by the AMSR Science Investigator-led Processing System at the GHRC.
  • Resources
    • Tools & Technologies
      • A collection of tools & technologies developed and/or used by GHRC.
    • Publications
      • View GHRC & ITSC publications on the ITSC website
    • Innovations Lab
      • The GHRC Innovations Lab is a showcase for emerging geoinformatics technologies resulting from NASA-sponsored research at the University of Alabama in Huntsville.
    • Educational Resources
      • A list of resources from NASA, MSFC, and other sources for teachers and students focused on global change, hydrology, and science education.
    • Referencing our data
      • GHRC dataset citation help and examples.
    • Documents
      • Documentation related to GHRC datasets, software, and other offerings.
    • Glossary
      • Terms and their definitions
    • Featured items
      • The latest tools from GHRC.
  • Multimedia
  • About
    • Welcome
      • Local resources, lodging information, and weather to help you plan your visit to GHRC.
    • GHRC Personnel
      • A list to help you keep in touch with our personnel
    • FAQ
      • Frequently Asked Questions about GHRC data and services, and their answers.
    • Data Citations and Acknowledgements
      • GHRC dataset citation help and examples
  • Cite Us
  • Contact Us
feedback
DOCUMENTATION

Documentation

Guide Documents

Dataset PI Documents

Dataset Software

The CAMEX-3 DC-8 Meteorological Measurement System

Table of Contents

Introduction
System Description
Data Reported to MMS
Primary Products
Secondary Products
Measured
Calculated
Data Format
5Hz Data
1Hz Data
References
Contact Information

DC-8 in flightIntroduction

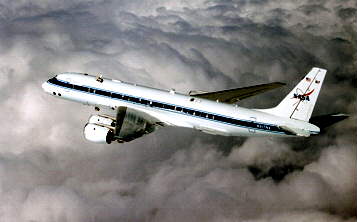
The NASA DC-8 Meteorological Measurement System consists of three major systems: an air-motion sensing system to measure air velocity with respect to the aircraft, an aircraft-motion sensing system to measure the aircraft velocity with respect to the earth, and a data acquisition system to sample, process, and record the measured quantities.

System Description

The air-motion system consists of two airflow-angle probes, three total temperature probes each with a different response time, a pitot-static pressure probe, and a dedicated static pressure system. All probes and sensors are judiciously located at specific positions of the fuselage. The aircraft-motion sensing system consists of an embedded GPS ring laser inertial navigation system (Litton LN-100G), and a multiple-antenna GPS attitude reference system (Trimble TANS Vector). The data system rack is located near station 840, and customized software was developed to control, sample, and process all sensors and hardware.

Data Reported to MMS

The primary dataset collecting all parameter types (listed in the data format section below), is gathered at 5Hz. Post flight, a subset of these data are created by averaging data over one second intervals, and reporting a 1Hz dataset of a reduced number of parameters. Thus, two datasets are available for every flight and are called 1Hz and 5Hz data. Primary and secondary products used by MMS are listed below.

Primary Products (1Hz & 5Hz) Typical value at 40,000 ft:

Pressure =~ 200 mb +/- 0.3 mb or =~ 0.5% br>
Temperature =~ 220 K +/- 0.3 K or =~ 0.2%
Horizontal Wind =~ 30 m s-1 +/- 1 m s-1 or =~ 4.0%
Vertical Wind < 1 ms-1 (Resolution: 0.1 m s-1)

Secondary Products: (1Hz & 5Hz)

Measured

positions
velocities
accelerations
pitch
roll
heading
angle of attack
angle of sideslip
dynamic & total pressures
total temperature

Calculated

potential temperature
true-air-speed
turbulence (0.8 - 1.5 Hz)

Data Format

The file name is of the form [Mm0803-5Hz], which tells the date of the flight (yy.ddd) and the type of data (1 or 5Hz). Each of the data files contain a header which describes the data which follows, and an example of the header portion of each type of data file is shown below.  The examples below are from the files [Mm0803-5Hz] and [Mm0803-1Hz] respectively.

5Hz Data

As seen in the table shown below, most of the entries in the header section of the file are self explanatory, but several are of note:

Line #1 (56 1001) indicates that there are 56 lines in the header (line 57 is the first line of data).
The first reported parameter is GMT in seconds and tenths: e.g. (from the first data line in purple) GMT is 66362.1 which converts to 18:26:02 GMT.
Line #11 & 12 (in blue) indicates the scaling factors for each of the reported parameters beginning with the second parameter. In this case, the scaling factor is 0.1.
Lines #13 and 14 (in green) gives the number of digits reported for each parameter in each data cycle.
Thus, when the first scaling factor from line #11 (.1) is applied to the first number (99999) in line #13, you can determine that the second data parameter is going to have five digits, and will be in tenths. Thus, 9380 reported in the first data line represents 938.0.
Units for the data parameters (again, beginning with the second because the first is GMT seconds) are listed next, and we find that the units of the second data parameter are millibars of static pressure, in the previous example: 938.0 mb.
A format line is provided six lines above the data lines for use with automated output.

56 1001


BUI, T. P.; S. Bowen; C. Chang; J. Dean-Day; L. Pfister; A. Trias
NASA - Ames Research Center
Meteorological Data from DC-8 MMS
CAMEX-3
1 1
1998 08 03   1999 11 02                     ;flight-date    process-date
0
Elapsed UT seconds of flight date
24
.1 .01 .01 .01 .01 .001 .01 .001 .001 .1 .01 .01
.01 .01 .01 .01 .001 .01 .01 .01  .0001 .001 .001 .001
99999 99999 99999 999999 999999 999999 99999 999999 9999999 999999 99999 99999
99999 99999 999999 999999 999999 999999 99999 99999 999999 999999 999999 999999
Static Pressure                    (Psta)     mb       0.1        99999
Static Temperature            *    (Tsta)      K       0.01       99999
True Air Speed                *    (TAS)     m/s       0.01       99999
E-W Horizontal Wind Speed     *    (U)       m/s       0.01       999999
N-S Horizontal Wind Speed     *    (V)       m/s       0.01       999999
Vertical Wind Speed           *@   (W)       m/s       0.001      999999
Log10 Turbulent Dissipation   *    (TEDR)    kW/kg     0.01       99999
Latitude +N                        (LAT)     deg       0.001      999999
Longitude +E                       (LONG)    deg       0.001      9999999
Hydrostatic Altitude               (HALT)      m       0.1        999999
Potential Temperature         *    (POT)       K       0.01       99999
Roll Angle +right wing down        (ROLL)    deg       0.01       99999
Heading Angle                      (HDG)     deg       0.01       99999
Pitch Angle                        (PITCH)   deg       0.01       99999
N-S Ground Speed +N                (Ydot)    m/s       0.01       999999
E-W Ground Speed +E                (Xdot)    m/s       0.01       999999
Vertical Speed   +U           @    (Zdot)    m/s       0.001      999999
Q (Compressible Dynamic Pressure)  (q)       mb        0.01       999999
Yaw Angle (sideslip angle)         (YAW)     deg       0.01       99999
Angle of Attack                    (AOA)     deg       0.01       99999
Mach Number                        (MACH)              0.0001     999999
Vertical Acceleration +U           (Zdotdot) m/ss      0.001      999999
Yaw delta P                        (Ydp)      mb       0.001      999999
AOA delta P                        (Adp)      mb       0.001      999999
3
EGI navigation data
Hydrostatic Altitude is an estimate of geometric altitude, accurate to 50 m.
FINAL DATA
13
@ Supressed when data gap is greater than 10 seconds.
Log10 turbulence values (normally < 0) are sign-reversed when the turbulent
sampling wavenumber is less than the buoyancy wavenumber.  Under such
conditions, computed dissipation rates may not be quantitative.  See explanation
in Chan et al., "Turbulence Measurements by the DC-8 Meteorological Measurement
System", Geophys. Res. Letters, 25-9, 1355-1358, 1998.

FORMAT(F8.1,3I6,3I7,I6,I7,I8,I7,2I6,/,1x,2I6,4I7,2I6,4I7) (87 & 81-byte per line)
At the request of users in the meteorological community, more significant
\camex.cv\d_980803.cv

  GMTS    Psta Tsta   TAS     U      V      W    TURB   LAT    LONG   HALT   POT   ROLL
  HDG    PIT   Ydot  Xdot    Zdot    Q     YAW   AOA   MACH  Zdotdot  Ydp    Adp
66362.1  9380 30677  8008   -455   -492    309  -619  34906 -117882   6458 31243   -96
  23891   642  -4632  -7309    -36   3460   -14   666   2281    442  -4878  15819
66362.3  9380 30679  8024   -459   -507    207  -653  34906 -117882   6460 31245   -87
  23899   659  -4645  -7333     54   3474   -13   670   2285    530  -4849  16109
66362.5  9380 30683  8057   -442   -514    465  -693  34906 -117883   6461 31249   -79
  23909   676  -4657  -7352    179   3502   -13   697   2294    731  -4849  17582
66362.7  9380 30681  8111   -409   -509    828  -668  34906 -117883   6463 31248   -68
  23917   691  -4670  -7371    336   3550   -11   726   2310    797  -4847  19201
66362.9  9380 30680  8181   -367   -495    822  -922  34906 -117883   6465 31246   -57
  23926   703  -4681  -7396    510   3613   -10   725   2330    980  -4780  19175
66363.1  9379 30685  8254   -317   -473    874  -783  34906 -117883   6468 31252   -44
  23933   714  -4688  -7414    708   3678    -9   725   2351    918  -4781  19186 

1Hz Data

Line #1 (42 1001) indicates that there are 42 lines in the header (line 43 is the first line of data).
The first reported parameter is GMT in seconds and tenths: e.g. (from the first data line in purple) GMT is 66364.9 which converts to 18:26:05 GMT.
Line #11(in blue) indicates the scaling factors for each of the reported parameters beginning with the second parameter. In this case, the scaling factor is 0.1.
Line #12 (in green) gives the number of digits reported for each parameter in each data cycle.
Thus, when the first scaling factor from line #11 (.1) is applied to the first number (99999) in line #13, you can determine that the second data parameter is going to have five digits, and will be in tenths. Thus, 9371 reported in the first data line represents 937.1.
Units for the data parameters (again, beginning with the second because the first is GMT seconds) are listed next, and we find that the units of the second data parameter are millibars of static pressure, in the previous example: 937.1 mb.

42 1001 


BUI, T. P.; S. Bowen; C. Chang; J. Dean-Day; L. Pfister; A. Trias 
NASA - Ames Research Center 
Meteorological Data from DC-8 MMS 
CAMEX-3 
1 1                                         ;ivol nvol 
1998 08 03   1999 11 02                     ;flight-date    process-date 
0                                           ;0=non-uniform time increment 
Elapsed UT seconds of flight date 
11                                          ;number of primary variables 
0.1   0.1  0.1  0.1  0.1  0.1  0.01  1.0   0.001  0.001   1.0   ;scale factors
99999 9999 9999 9999 9999 9999 99999 99999 999999 9999999 99999 ;missing values
Static Pressure (mb) 
Static Temperature (K) 
Theta - potential temperature (K) 
U - horizontal E-W wind speed (m/s) 
V - horizontal N-S wind speed (m/s) 
W - vertical wind speed (m/s) 
TEDR - LOG10 of Turbulent energy dissipation rate (kW/kg) (see note below) 
Hydrostatic Altitude (m) 
Latitude +N (deg) 
Longitude +E (deg) 
Differental GPS Altitude (m) 

EGI navigation data 
Hydrostatic altitude is an estimate of geometric altitude, accurate to 50 m. 
Differential GPS altitude is available only when DGPS signals were received. 
FINAL DATA 
13 
Log10 turbulence values (normally < 0) are sign-reversed when the turbulent 
sampling wavenumber is less than the buoyancy wavenumber.  Under such 
conditions, computed dissipation rates may not be quantitative.  For 
explanation, see Chan et al., "Turbulence Measurements by the DC-8 
Meteorological Measurement System", Geophys. Res. Letters, SUCCESS special 
section, 1998. 

1Hz data are desampled from 5Hz data. 
5Hz data file is available upon request, containing: GMTS,Psta,Tsta,TAS, 
U,V,W,TURB,LAT,LONG,PALT,POT,ROLL,HDG,PIT,Ydot,Xdot,Zdot,Q,YAW,AOA,MACH, 
Zdotdot,YAWdp,AOAdp.                   (approx. 3 Mbyte per flight hour) 
\camex.cv\d_980803.cv 
GMTsec   Psta Tsta Thta   U    V    W   TEDR H_ALT  LAT    LONG   DGPS_ALT 
66364.9  9371 3068 3126  -16  -40    2  -737   655  34905 -117885 99999
66365.9  9365 3067 3125  -17  -39   10  -770   660  34905 -117885 99999
66366.9  9361 3066 3125  -14  -35    1  -807   664  34904 -117886 99999
66367.9  9353 3066 3125  -22  -36    6  -850   672  34904 -117887 99999
66368.9  9347 3065 3125  -14  -36    6  -799   678  34904 -117888 99999
66369.9  9341 3065 3125  -12  -34    3  -857   684  34903 -117889 99999
66370.9  9333 3064 3125  -12  -34    0  -762   691  34903 -117890 99999


References

Chan, K. R., S. W. Bowen, and J. D. Day, Observation of Turbulence by DC-8 MMS, presented at the AEAP Virginia Beach Meeting, VA, April 1997.

Bui, T. P., DC-8 Meteorological Measurement System, presented at the SONEX Workshop, NASA Ames Research Center, February 1997.

Contact Information

To order these data or for further information, please contact:

Global Hydrology Resource Center
User Services
320 Sparkman Drive
Huntsville, AL 35805
Phone: 256-961-7932
E-mail: support-ghrc@earthdata.nasa.gov
Web: http://ghrc.nsstc.nasa.gov/


ITSC

UAH

RSS feed GHRC Facebook GHRC Twitter

NASA Official:
Manil Maskey

Website maintained by the
UAH ITSC Web Team

If you have trouble viewing or
navigating this page, please contact
GHRC User Services

NASA Web Privacy Policy and Important Notices


    The GHRC is a member of the ICSU World Data System