CAMEX-4 ER-2 Microwave Temperature Profile
Table of Contents
Introduction
The fourth field campaign in the Convection and Moisture Experiment series (CAMEX-4) ran from 16 August to 25 September, 2001 and was based out of Jacksonville Naval Air Station, Florida. CAMEX-4 focused on the study of tropical cyclone (hurricane) development, tracking, intensification, and landfalling impacts using NASA-funded aircraft and surface remote sensing instrumentation. The NASA ER-2 carried numerous instruments during the the experiment.
The Microwave Temperature Profiler (MTP) retrieves profiles of air temperature versus altitude along an aircraft flight track. It does this by measuring the natural thermal microwave emission from oxygen molecules in the earth’s atmosphere, and then performing a statistical retrieval inversion procedure. This retrieval is based on an archive of thousands of atmospheric soundings that results in the most likely temperature profile given the measurements.
JPL, the instrument owner, has an outstanding web page that has detailed information about the instrument and remote microwave remote sensing in general. Additionally, there is provided an instrument history, photos and tools for use in data analysis. That web page is located at the Microwave Temperature Profiler web site, which links to an excellent tutorial about microwave temperature measurements.
Instrument Description
The airborne MTP instrument is a passive microwave radiometer that measures thermal emission from oxygen molecules along the viewing direction. A stepper motor rotates a 45-degree shaped reflector so that radiation entering a receiving horn is sequenced through a set of 10 elevation angles, ranging from -58.2 to +60.0 degrees (within a vertical plane that is offset 20 degrees in azimuth from the direction of flight). At each viewing position a local oscillator is sequenced through two frequencies: 56.66 and 58.80 GHz. Each 14-second observing cycle produces a set of 20 brightness temperatures, which are converted by a linear retrieval algorithm to a profile of air temperature versus altitude. Altitude coverage is 15 to 25 km while flying at 19 km. T(z) profiles are obtained every 2.9 km along the flight path.
There is more information available about the instrument, installation and display available here.
Data Products and Format
Data are 'tarred' into daily (mission) data files of the form:
c4emtp_2001.jjj_011mm.tar
where c4emtp represents CAMEX-4 and the ER-2 MTP instrument, 2001.jjj is the four digit year and day of year, 011mm is the unique mission number.
When untarred, this will yield a datafile and a .gif file. File naming convention for the data file is:
MP2001mmdd.ER2
where MP identifies the data as from the microwave profiler, 2001mmdd is the four digit year month and day of month. ER-2 advises that these data are from the ER-2 mounted instrument. The data is in ascii, with a large descriptive header. This header describes in detail the format of the data which follows. An example is shown below:
Standard error of retrieved air temperture (K)
Geometric altitude (meters).
Molecular air density (number per cubic meter)
12             {number of auxiliary variables}
1.0 1.0 1.0 1.0 1.0 1.0 1.0 1.0 1.0 1.0 1.0 1.0
99 99.999 99.9 99.9 999.9 99.9 99.9 999.9 999.9 99.999 999.999 999.9
NX(1) is the number of altitudes in subsequent data records
Pressure altitude of ER-2 (km)
Aircraft pitch (deg)
Aircraft roll (deg)
Horizon brightness temperature (ie, OAT, similar to SAT); avg ch1 & ch2(K)
Tropopause #1 (km).
Tropopause #2 (km).
Potential temperature of tropopause #1 (K).
Potential temperature of tropopause #2 (K).
Latitude (deg)
Longitude (deg)
dT/dz (K/km) for 1.0 km layer centered on aircraft flight altitude.
6              {number of special comment lines}
*** The ER-2 Nav Data Recorder temperature and pressure altitude are seriously
*** in error, and could affect the quality of these retrievals. See URL:
*** http://mtp.jpl.nasa.gov/missions/camex4/Science/NDR_Corrections.html
*** for details.
***
***
19             {number of normally included comment lines}
Here's a brief free-form tutorial on how to decipher the MTP data: Data groups
   consist of the following group of lines per 15-second observing cycle.
First line is:  UTSEC, number of retrieval levels in following table, Pressure
   Altitude, Pitch, Roll, Outside air temp (K), tropopause altitude #1 (km),
   tropopause altitude #2 (km) [if present], potential temperatures of tropopause
   #1 and #2, latitude, longitude, & lapse rate near flight level.
   The 1-liners (for each cycle) can be stripped & imported into a spreadsheet
   for convenient plotting of trop altitude, lapse rate, etc. The tropopause
   altitudes are calculated by cubic spline interpolation of the retrieved
   altitudes using the WMO definition (that is, trop #1 is lowest altitude
   where average lapse rate > -2 K/km from initial -2 K/km point to any point
   within 2 km; trop #2 occurs above first trop after lapse rate is < -3K/km
   for >1 km, and then first trop definition applies, possibly from within
   the 1 km region.)
Remaining set of lines for each cycle consist of 5 columns: col#1 is pressure
   altitude (meters), col#2 is temperature from MTP (Kelvin), col#3 is temperature
   error estimate (K), col#4 is geometric altitude (meters), based on GPS
   altitude (meters), and col#5 is molecular air density [1E+21/m3].
...
64360 30  19.520   0.2  -0.4 208.8  15.2  99.9 369.8 999.9  28.032  -80.671   1.8
 28520 225.2 3.3 28800   470
 26420 222.0 2.6 26700   657
 24720 219.4 2.0 25000   864
 23530 217.3 1.7 23810  1050
 22720 215.7 1.4 23020  1199
 22020 214.1 1.2 22330  1347
 21520 212.8 1.1 21840  1465
 21120 211.9 1.0 21450  1567
 20820 211.2 0.9 21160  1648
 20520 210.6 0.8 20860  1732
 20220 210.1 0.8 20570  1821
 20020 209.8 0.7 20380  1882
 19820 209.4 0.7 20180  1945
 19670 209.2 0.6 20040  1994
 19520 208.9 0.6 19890  2044
 19370 208.7 0.6 19750  2095
 19220 208.4 0.7 19600  2148
 19020 208.0 0.7 19410  2222
 18820 207.4 0.8 19220  2300
 18520 206.4 0.9 18930  2422
 18220 205.5 0.9 18640  2551
 17920 204.6 1.0 18360  2687
 17520 203.2 1.2 17980  2881
 17020 201.7 1.3 17510  3140
 16320 200.0 1.6 16860  3538
 15520 199.5 1.8 16120  4022
 14420 202.5 2.5 15090  4714
 13020 210.3 3.7 13750  5660
 11520 221.0 4.1 12260  6825
 10020 233.0 4.2 10690  8183
...
|
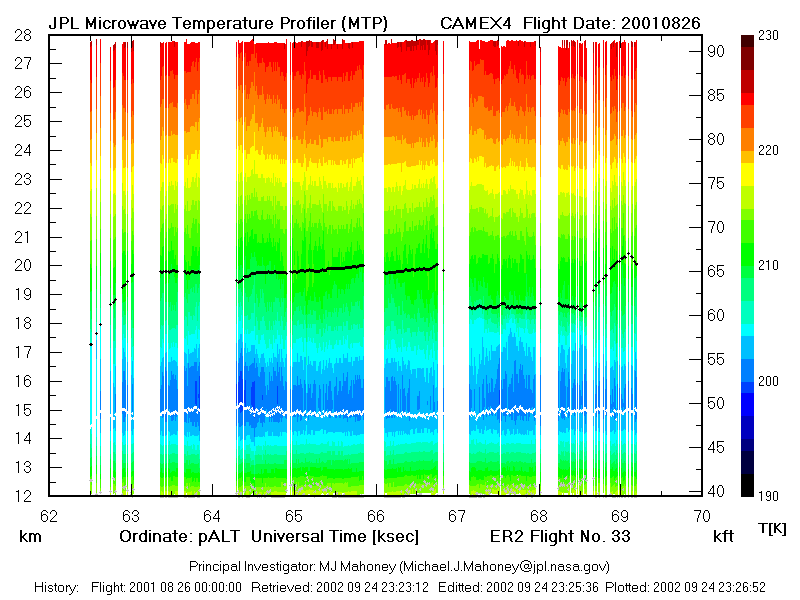
TZS_2001mmddte.png
is the file name for the image file that may be viewed with almost any image viewer and appears below:
Contact Information
To order these data or for further information, please contact:
Global Hydrology Resource Center
User Services
320 Sparkman Drive
Huntsville, AL 35805
Phone: 256-961-7932
E-mail: support-ghrc@earthdata.nasa.gov
Web: http://ghrc.nsstc.nasa.gov/
|


