GOES Water Vapor Transport Climate Data
Table of Contents
Summary
This file contains documentation to support the 1987/88 GOES Water Vapor Transport Climate Dataset and describes the dataset, how it was made, and its limitations. Addition information may be found at the Global Hydrology and Climate Center.
Directory Structure (on CD)
The data are contained on the distribution CD in the following self-explanatory directory structure:
software/
point_data/
daily/
bin/
mcidas/
grid_data/
daily/
bin/
mcidas/
sample_gifs/
monthly/
bin/
mcidas/
sample_gifs/
Directory contents/Data inventory (on DC)
The root directory contains Readme.txt and Readme.htm for a summary of what you will need to know about this dataset. It is recommended that Readme.htm is used since links to supporting documentation, sample GIF images, and contact point information (URLs) may be easily accessed.
The /point_data subdirectory contains a subdirectory of daily point data files that are further separated into both McIDAS and BINARY file formats. These files are of different length depending on how many wind vectors were successfully retrieved. Unlike the gridded data, many of these files extend poleward of 45N and 30S.
The /grid_data directory is separated into both /daily and /monthly subdirectories that are both further divided according to the data format (either McIDAS or BINARY). Both /daily and /monthly directories have a /sample_gifs subdirectory to assist you in verifying the data is being read correctly. The gridded data contain 1 X 1 degree data fields for the 19 month GOES Pathfinder period with the exception of the days listed in Table 2.1. These days were missing due to either: errors in satellite navigation, lack of three consecutive hourly images to produce reliable winds, or large missing sectors in scan.
Table 2.1: Days where water vapor wind retrievals were not made due to scheduling, missing sections of scan, or navigation errors.
Beginning of dataset May 5, 1987
                 End of dataset Nov 31, 1988

                 Month   Day of month    Day of year
                 ==================================
                 1987

                 Jun     1               152
                         3-4             154-155
                         28              179
                 Jul     1               182
                         4               185
                         8               189
                         17-18           198-199
                         20              201
                         23              204
                         25              206
                 Aug     2               214
                         14              226
                         23              235
                 Sep     1               244
                 Oct     31              304
                 Dec     3               337

                 1988
                 Jan     1-4             001-004
                 Feb     5               036
                         15              046
                 Mar     2               062
                 Apr     24              115
                 May     8               129
                         30              151
                 Jun     3               155
                         22              174
                 ==================================

                 1987 total missing: 18
                 1988 total missing: 12

                 Total number of missing days: 30
Total possible days: 576 (5% missing)
Summary of retrieval techniques
WINDS
The water vapor winds were derived using the Marshall Automated Winds (MAW) tracking algorithm (Atkinson 1984; Jedlovec et al. 1999). MAW uses a minimum-difference template matching scheme for feature identification. Three water vapor images (1100, 1200, and 1300 UTC) were used to determine a pair of wind vectors for each template of the image. Due to scheduling changes or missing data, three alternate hourly images were used on several days during the 19 month period (see Table 3.1). A template size of 49 X 49 pixels (pixel size: 8 X 8 km) was used to track the movement of features from image to image. The quality and control procedures used to create all gridded data fields included a vector pair discrepancy of 15 m/s in speed and 30 degrees in direction. Using these quality and control procedures reduces random errors with the GOES-VAS data to less than 4 m/s (Jedlovec and Atkinson 1996).
Table 3.1: List of alternate times used in making wind retrievals. For days not listed, default retrieval image times are 1100, 1200, and 1300 UTC.
Date            Days of Year    Times used (UTC)
=================================================
1987

May 5 - May 31  125-151         1300,1400,1500
Jun 4 - Jun 30  155-181         1400,1500,1600
Jul 2           183             1300,1400,1500
Jul 3 - Jul 18  184-199         1400,1500,1600
Jul 27          208             1400,1500,1600
Aug 3           215             1400,1500,1600
Nov 16 - Nov 17 320-321         1000,1100,1200
Nov 22 - Nov 23 326-327         1000,1100,1200
Dec 1           335             1400,1500,1600
Dec 15          349             1200,1300,1400
Dec 17          351             1400,1500,1600

1988

Mar 5           065             1200,1300,1400
Apr 13          104             1300,1400,1500
Apr 16          107             1300,1400,1500
May 9           130             1000,1100,1200
May 24          145             1300,1400,1500
May 26          147             1000,1100,1200
Jun 7           159             1400,1500,1600
Jun 15          167             1400,1500,1600
Jul 8 - Jul 9   190-191         1400,1500,1600
Jul 11          193             1400,1500,1600
Sep 19 - Sep 21 263-265         1000,1100,1200
Sep 29          273             1000,1100,1200
Oct 29          303             1300,1400,1500
Nov 5           310             1000,1100,1200
Nov 15 - Nov 16 320-321         1000,1100,1200
Nov 20          325             1000,1100,1200
Nov 24          329             1300,1400,1500
Nov 26          331             1000,1100,1200
===============================================
HUMIDITY
Relative humidity is calculated using a modified version of the Soden and Bretherton (1996) brightness temperature to relative humidity conversion technique. More details about the modifications are posted at http://wwwghcc.msfc.nasa.gov/irgrp/wvti.html. Relative humidity (RH) is converted to specific humidity (q) by using the simple formula:
q ~= qs x RH / 100
where the saturated specific humidity qs, is given by:
qs = (621.97 x esi) / p.
p is the wind pressure height. The saturated vapor pressure is calculated with respect to ice; i.e.
esi = 6.11 X 10 **([9.5 * Tb] / [Tb+ 265.5]) (3.1)
The template averaged brightness temperature is denoted by T b in Equation 3.1 above.
HEIGHT ASSIGNMENT
Pressure heights are assigned to each wind vector using the simple IR window technique first proposed by Fritz and Winston (1962). This simply involves matching the template averaged 6.7 µm brightness temperature to a nearby model temperature profile. For this dataset, the NCEP/NCAR reanalysis temperature profile at 5 X 5 degree resolution at 1200 UTC daily was used.
Point data description
McIDAS Format (MD files)
The McIDAS MD files are named:
MDXyyddd
where yy is the year and ddd is the day of year (eg. 88239)
The McIDAS MD file structure places irregularly spaced data points into individual records within the file structure. Each record contains the variables outlined in an MD file "SCHEMA" which is provided under the /point_data/daily/mcidas subdirectory. A sample record of a single retrieval point is shown in Table 4.1.
Table 4.1: Example of MD file record
--RECORD AT (ROW,COL) = (   1, 164)

|DAY  =     88239 SYD  | TIME =    120100 HMS  | LAT  =   22.2063 DEG
|LON  =   83.7576 DEG  | U    =     -1.86 MPS  | V    =    -10.24 MPS
|P    =       296 MB   | T    =       241 K    | RH   =        46 PCT
|Q    =     0.288 GPKG | FLAG =         2      | SDEV =         8 MPS
|DDEV =         1 DEG  |
FLAG corresponds to the error code for that particular record. Table 4.2 lists the possible error codes associated with each retrieval. The number for the error code may represent the sum of two or more errors.
SDEV is the speed deviation among two vectors used to produce the final wind vector. This is one of the quality and control constraints in producing the grid files.
DDEV is the directional deviation among the two vectors. A DDEV of 30° or greater was used in flagging vectors as bad for producing grids.
Table 4.2: Quality and control error codes for McIDAS MDFILE point data FLAG parameter. Actual error code may represent sum of different QC error codes.
  -----------------------------------------------------------------
  ---
  --- ERROR CODES:
  ---   -4 - MANUAL CHECK FAIL
  ---    0 - NO ERROR
  ---    1 - U DEPARTURE FROM GUESS
  ---    2 - V DEPARTURE FROM GUESS
  ---    3 - U & V DEPARTURE FROM GUESS
  ---   10 - U ACCELERATION
  ---   20 - V ACCELERATION
  ---   30 - U & V ACCELERATION
  -----------------------------------------------------------------
   -4    : Manual check fails correspond to individual retrievals that
           were flagged as bad vectors by subjective analysis.
   1-3   : Departure from guess error codes should be disregarded since
           no guess wind speed and direction were used to create the
           dataset.
10,20,30 : Acceleration error code flags correspond to the 2 vectors
           used to generate the final wind retrieval vector (i.e. V1 from
           the 1100 and 1200 imagery; and V2 from 1200 and 1300 imagery).
           If the second of 2 vectors (used to determine the final vector)
           underwent acceleration greater than 5 m/s, then it is flagged.
  -----------------------------------------------------------------
The McIDAS MD file naming convention is similar to the grid files (i.e., MDXyyddd where yy is year (e.g., 88) and ddd is the day of year (e.g., 239)).
Binary Data Format
The binary version of the McIDAS MD files are named
MDXyyddd.bin
where yy is year (e.g., 88) and ddd is the day of year (e.g., 239).
The binary point data files contain several hundred sets of 11 values, corresponding to the parameters listed in Table 4.3. The number of sets varies with file. In each set, the first two values are 4-byte words and the remaining nine are 2-byte words (see figure below). Each set is therefore 26 bytes.
Set 1 Set 2
Lat Lon U V P T RH Q fl sd dd Lat Lon U V P T RH Q fl sd dd ...
|----|-----|----|--|---|--|------|--|--|----|---|-----|------|---|--|---|---|-----|--|---|---|---| ...
The scaling factors needed to properly decode the values are found in Table 4.3 below. Values in binary file need to be divided by the appropriate scale factor to find the proper geophysical values.
Table 4.3: Scaling factors for decoding values in binary point data files.
   Parameter    Units   Scale
                        factor
   ______________________________
   Latitude     deg     10000
   Longitude    deg     10000
   U            m/s     100
   V            m/s     100
   Pressure     hPa     1
   Temperature  K       1
   RH           %       1
   Q            g/kg    1000
   flag         N/A     1
   speed dev    m/s     1
   dir dev      deg     1
Sample Read Software
Sample read (C) software for point data is located in software/read_mds.c. The (standard) output of this program is an ASCII tabular listing of all points in the file (with a 2 line header). Modify the source code to meet your output format requirements. Compile the code, then execute it as follows:
read_mds binary_MD_file
e.g., read_mds MDX88126.bin
The program was designed for either Unix or PC/VAX use. For Unix machines, no options/changes are required. For PCs or VAXs, either define the variable PCVAX in the source code or simply compile with the -D (Define) option like so:
cc -o read_mds read_mds.c -DPCVAX
The latter will define the variable PCVAX with a value of 1.
* To avoid potential processor differences, it is helpful to compile on the machine where the code will be executed.
Grid Data Description
McIDAS Format (GRID Files)
The McIDAS GRID files are named:
GRIyyddd
where yy is year (e.g., 88) and ddd is the day of year (e.g., 239).
The McIDAS grid file domain extends from 30S 120W in the lower left corner to 45N 30W in the upper right corner producing a total of 76 rows and 91 columns. Each grid file contains 10 grids (arrays) corresponding to 10 variables. A McIDAS listing example is given in Table 5.1. The grids were produced from the McIDAS point-data (MD) files using a Barnes style objective analysis (Barnes 1964) to generate the 1 x 1 degree resolution grids. The quality control constraints include a speed and directional deviation check. A pair of vectors are derived from three consecutive satellite images. Speed deviations greater than 15 m/s and directional deviations greater than 30° among the vectors were deemed bad and excluded from the gridding process. There was a final manual (subjective) check of outstanding wind vectors to screen out obvious errors.
Table 5.1: Example of McIDAS GRID file listing:
Grid file: 88239 **GOES WVT GRIDS 88239 **
# YYDDD HHMMSS NAME LEVEL SRC VT NR NC LLNW ROWINC COLINC
----- ----- ------ ---- ------- ---- -- -- -- -------- ------ ------
1 88239 120100 U TRO MDX 0 76 91 45/ 120 1.0000 1.0000
2 88239 120100 V TRO MDX 0 76 91 45/ 120 1.0000 1.0000
3 88239 120100 T TRO MDX 0 76 91 45/ 120 1.0000 1.0000
4 88239 120100 P TRO MDX 0 76 91 45/ 120 1.0000 1.0000
5 88239 120100 RH TRO MDX 0 76 91 45/ 120 1.0000 1.0000
6 88239 120100 Q TRO MDX 0 76 91 45/ 120 1.0000 1.0000
7 88239 120100 SPD TRO MDX 0 76 91 45/ 120 1.0000 1.0000
8 88239 120100 qv TRO MDX 0 76 91 45/ 120 1.0000 1.0000
9 88239 120100 qu TRO MDX 0 76 91 45/ 120 1.0000 1.0000
10 88239 120100 WVTI TRO MDX 0 76 91 45/ 120 1.0000 1.0000
---End of Listing
-------------------------------------------------------------------------
U is the East-West component of the wind (positive Westerlies)
V is the North-South component of the wind (positive Southerlies)
T is the template-averaged brightness temperature
P is the GOES wind pressure height
RH is the relative humidity
Q is the specific humidity
SPD is the total wind speed
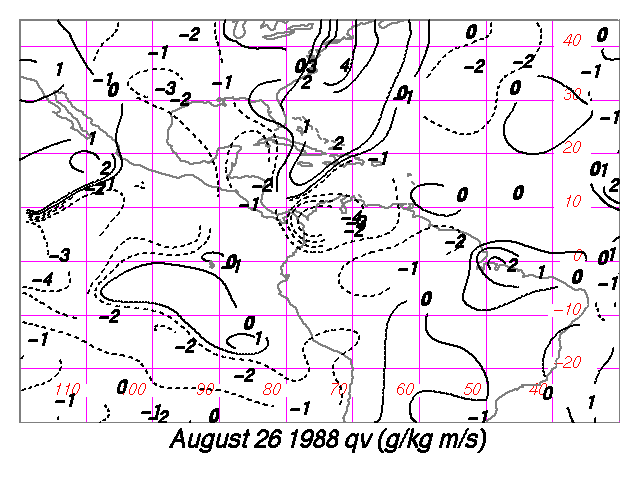
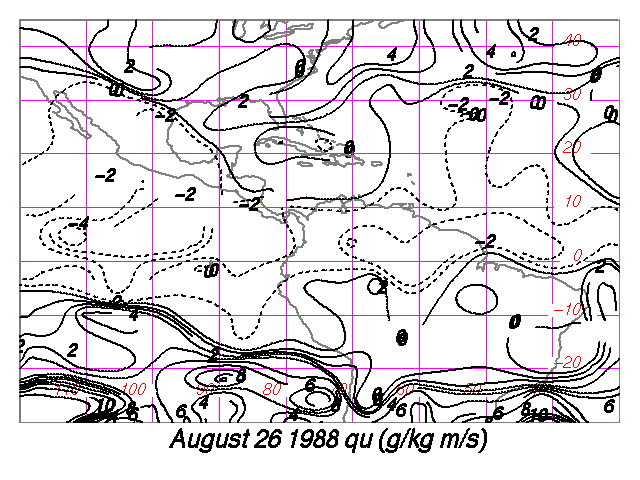
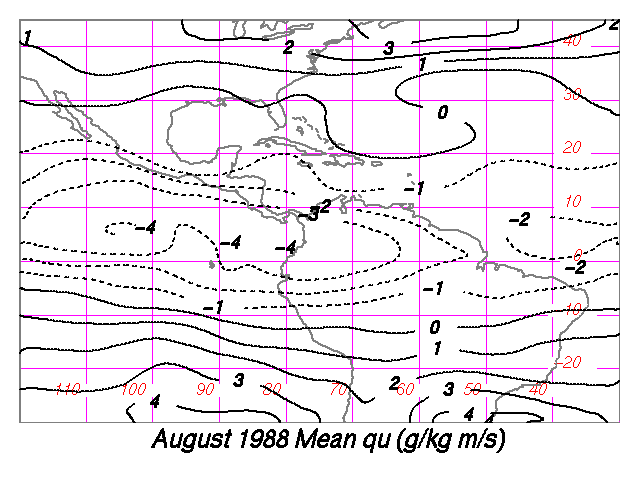
qu is the zonal transport of specific humidity (q)
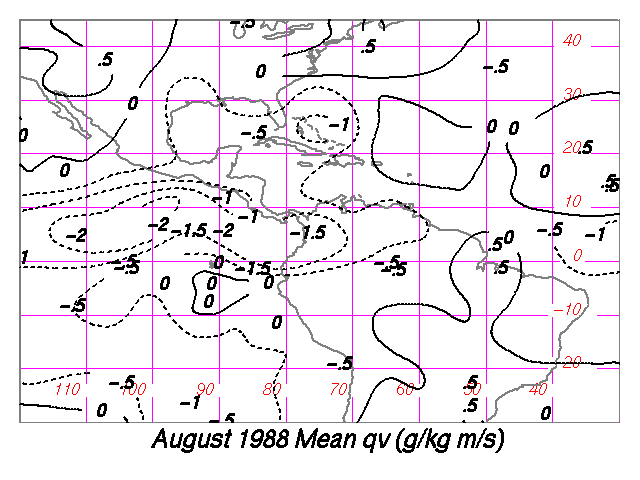
qv is the meridional transport of specific humidity (q)
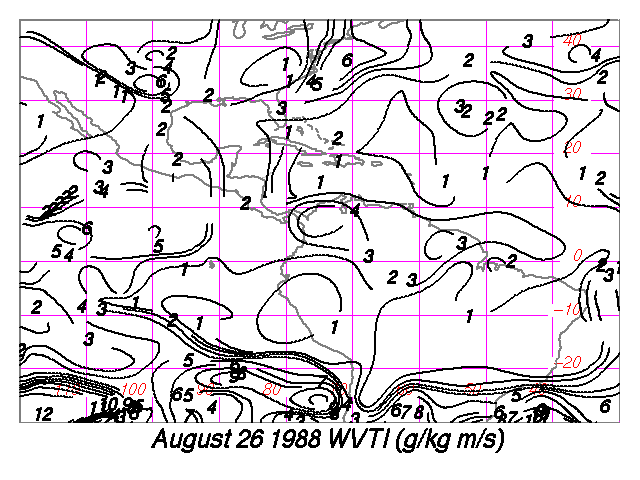
WVTI is the Water Vapor Transport Index (q * SPD)
Binary Format
The binary version of the McIDAS GRID files are named
GRIyyddd.bin
where yy is year (e.g., 88) and ddd is the day of year (e.g., 239).
Each binary gridded data file contains 10 grids, each with 76 rows and 91 columns. There are no headers or separators. All values are 2-bytes. Each array is therefore 6916 2-byte words long or 13832 bytes. With 10 grids, each file is therefore 138320 bytes. The grids are in the following order:
   Parameter    Units   Scale
                        factor
   _______________________________
   U            m/s      100
   V            m/s      100
   Temperature  K        1
   Pressure     hPa      1
   RH           %        1
   Q            g/kg     1000
   Wind Speed   m/s      100
   QV           g/kg m/s 100
   QU           g/kg m/s 100
   WVTI         g/kg m/s 100
Sample Read Software
Sample read (C) software for daily and monthly grid data is located in /software/read_grids.c. The (standard) output of this code is an ASCII listing of all 10 grids in the file (each with a 1 line header/title). Each line (except the title) of the file has 91 values of varying field widths (depending on parameter). Modify the source code to meet your output format requirements. Compile the code, then execute it as follows:
read_grids binary_grid_file
e.g., read_grids GRI88126.bin
The program was designed for either Unix or PC/VAX use. For Unix machines, no options/changes are required. For PCs or VAXs, either define the variable PCVAX in the source code or simply compile with the -D (Define) option like so:
cc -o read_grids read_grids.c -DPCVAX
The latter will define the variable PCVAX with a value of 1.
* To avoid potential processor differences, it is helpful to compile on the machine where the code will be executed.
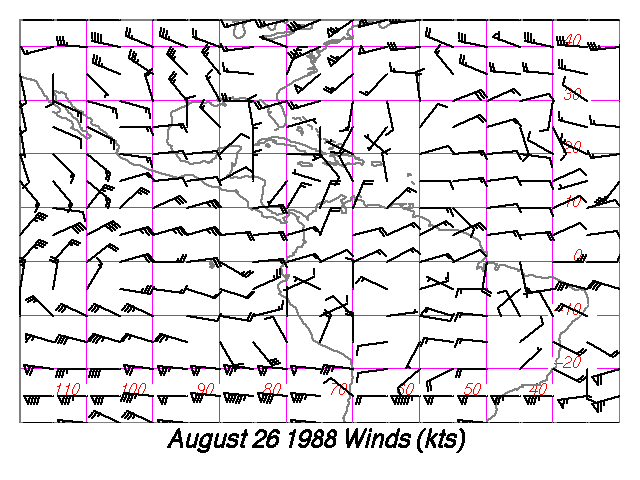
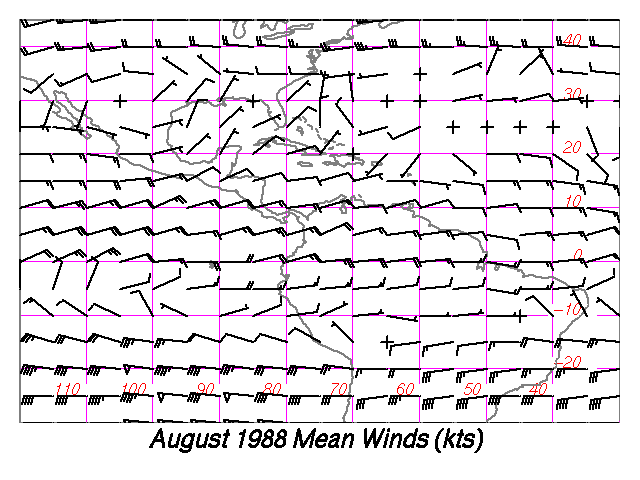
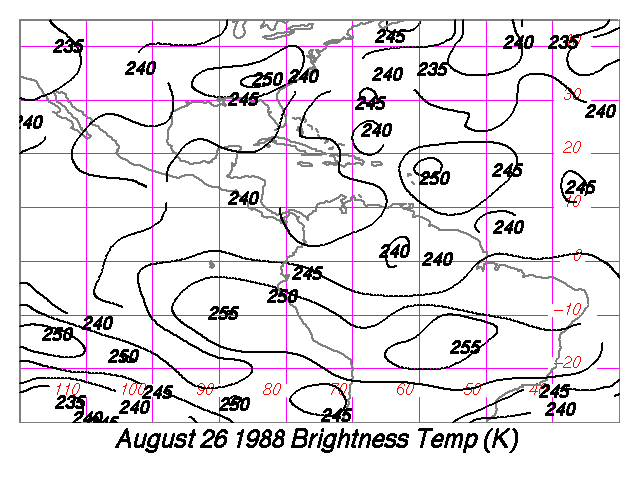
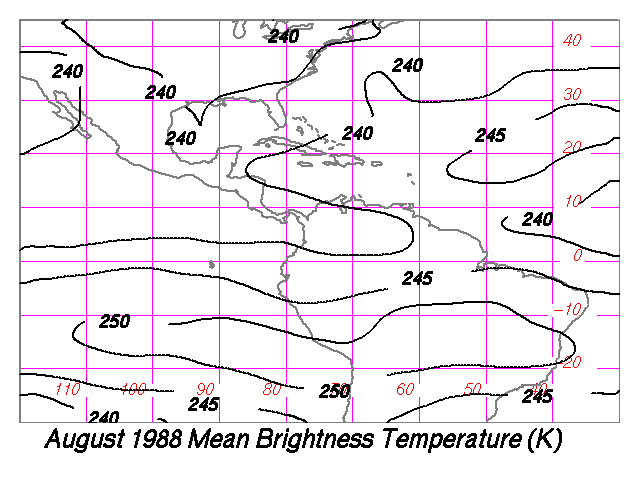
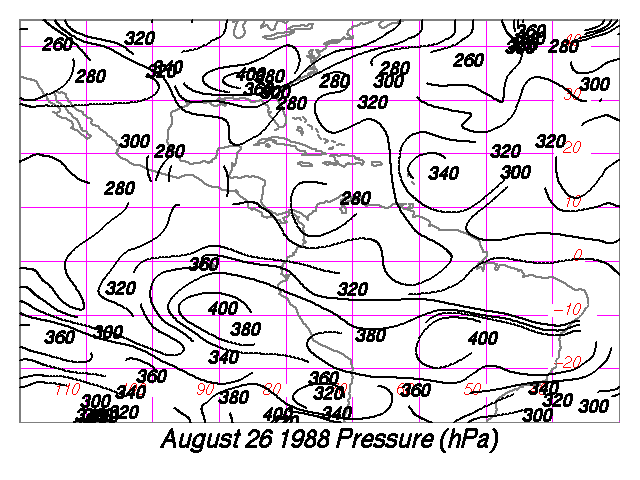
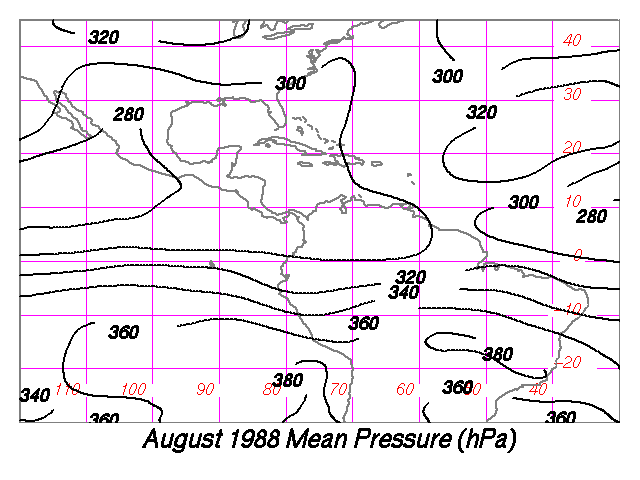
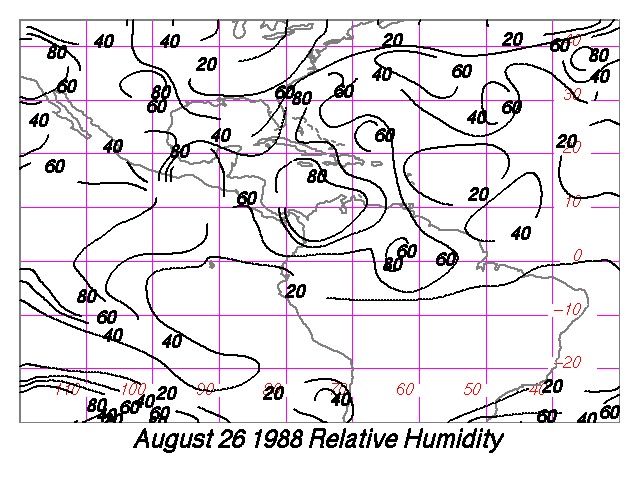
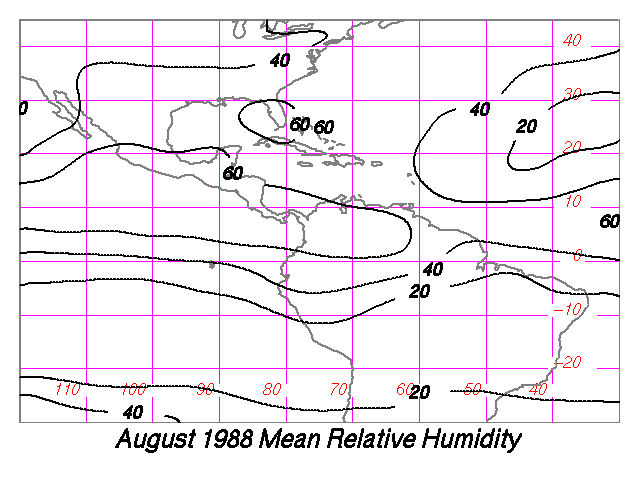
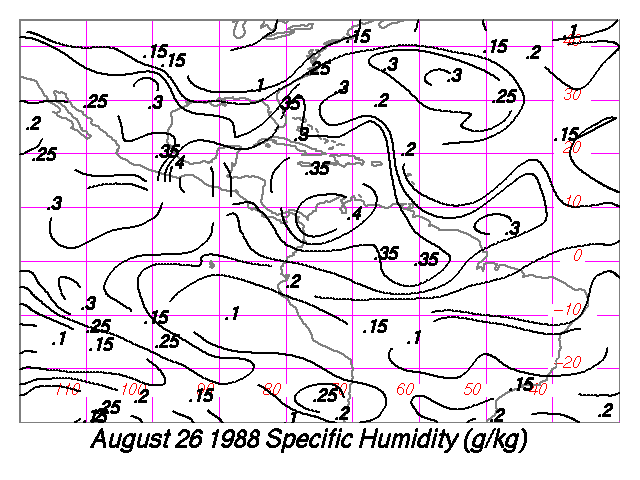
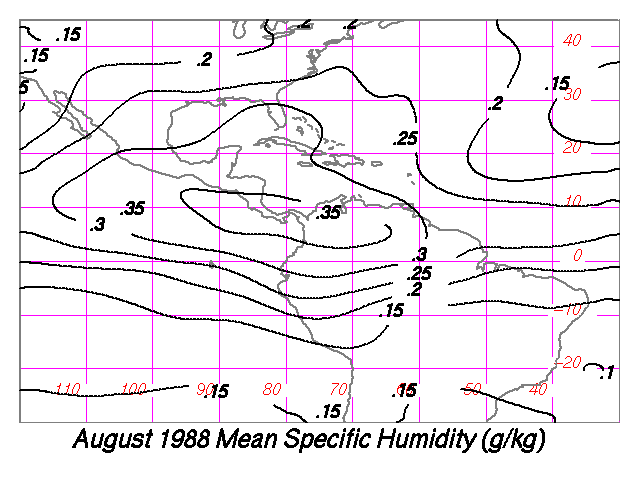
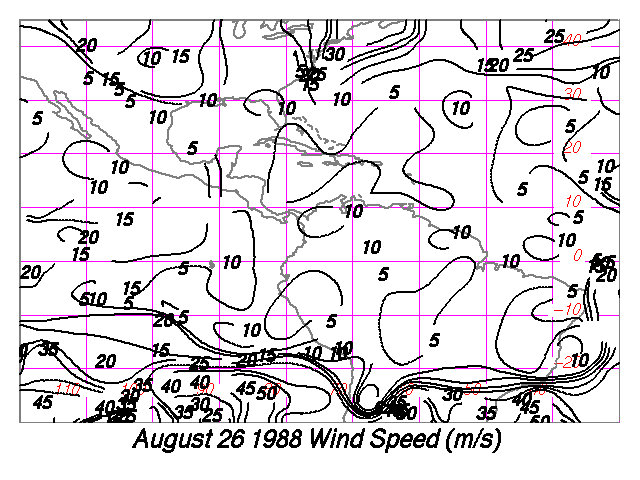
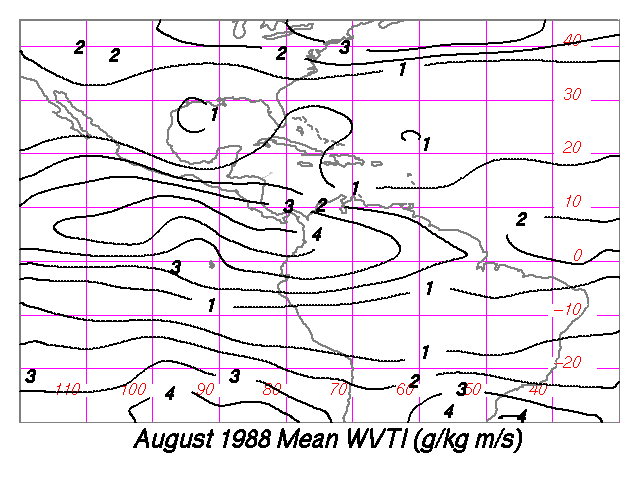
Sample Images
Samples of daily and monthly grids are available. These GIFs were created using McIDAS. Any GIF viewer or browser will work.
T 5.3 |
Daily Grid Images |
Monthly Mean Images |
Winds |
|
|
T |
|
|
P |
|
|
RH |
|
|
Q |
|
|
SPD |
|
|
qv |
|
|
qu |
|
|
WVTI |
|
|
References
Atkinson, R. J., 1984: Automated mesoscale winds determined from satellite imagery. Interim Report on NAS8-34596, General Electric Company, Huntsville, AL, 51 pp.
Barnes, S. L., 1964: A technique for maximizing details in numerical weather map analysis. J. Appl. Meteor., 3, 396-409.
Fritz, S. and J.S. Winston, 1962: Synoptic use of radiation measurements from satellite TIROS-II. Mon. Wea. Rev., 90, 1-9.
Jedlovec, G. J., and R. J. Atkinson, 1996: Quality and control of water vapor winds. Proceedings of the Eighth Conf. on Satellite Meteorology and Oceanography, AMS, Boston, 5-9.
Jedlovec, G. J., J. A. Lerner, and R. J. Atkinson, 1999: A satellite derived upper-tropospheric water vapor transport index for climate studies. J. Appl. Meteor., (submitted)
Kalnay, E., M. Kanamitsu, R. Kistler, W. Collins, D. Deaven, L. Gandin, M. Iredell, S. Saha, G. White, J. Woollen, Y. Zhu, M. Chelliah, W. Ebisuzaki, W. Higgins, J. Janowiak, K. C. Mo, C. Ropelewski, J. Wang, A. Leetmaa, R. Reynolds, R. Jenne, and D. Joseph, 1996: The NCEP/NCAR 40-year reanalysis project. Bull. Amer. Meteor. Soc., 77, 437-471.
Soden, B.J. and F.P. Bretherton, 1996: Interpretation of TOVS water vapor radiances in terms of layer-average relative humidities: Method and climatology for the upper, middle, and lower troposphere. J. Geophys. Res. 101, 9333-9343.
Contact Information
This dataset is produced at the Global Hydrology and Climate Center (GHCC) / NASA Marshall Space Flight Center. The dataset production is carried out by the Infrared Measurements Group of the Earth Sciences Division. Distribution and archiving is done by the Global Hydrology and Resource Center (GHRC). Further technical inquiries may be directed towards Gary Jedlovec (gary.jedlovec@nasa.gov).
To order these data or for further information, please contact:
Global Hydrology Resource Center
User Services
320 Sparkman Drive
Huntsville, AL 35805
Phone: 256-961-7932
E-mail: support-ghrc@earthdata.nasa.gov
Web: http://ghrc.nsstc.nasa.gov/
|


