 |
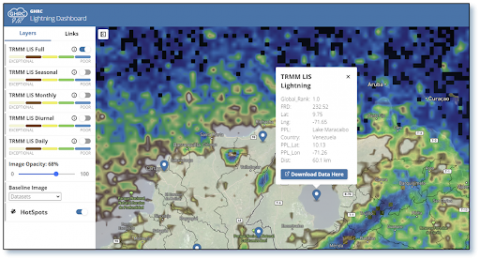 |
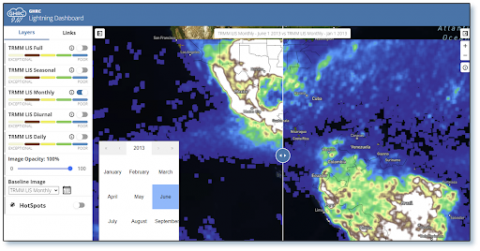
Lightning data is a key component of GHRC’s holdings and lightning datasets make up the majority of the top ten datasets downloaded from GHRC. This makes lightning data a top candidate for GHRC’s science enabling efforts. GHRC received funding to create a minimum viable product for a lightning dashboard by the end of fiscal year 2022. The project leverages our open source and cloud-based expertise from the Field Campaign Explorer. To accomplish this, GHRC has focused on two of our most popular lightning datasets: the high resolution lightning climatologies from the Lighting Imaging Sensor (LIS) and Optical Transient Detector (OTD). These provide a full period of record climatology as well as seasonal, monthly, and daily climatologies. Future efforts will add the ground-based lightning mapping array data as well as the soon to be archived data from the Geostationary Lightning Mapper. Additionally, the science team envisions the lightning dashboard as the next step for the visualization and analysis of NASA lightning data.
