Field Campaign Explorer (FCX) Publicly Released - October 2020
The Field Campaign Explorer is an open source, cloud-based tool for 3D data visualization and the analysis of data from ground-, airborne-, and satellite platforms. This image shows a vertical cross-sectional view of storms using data from the aircraft-mounted Cloud Radar System. The FCX combines multiple datasets to generate 3D views of atmospheric phenomena. Along with data from the Cloud Radar System, this image also shows 3D observations of lightning flashes from the Oklahoma Lightning Mapping Array that provides additional insight into storm structure and severity.
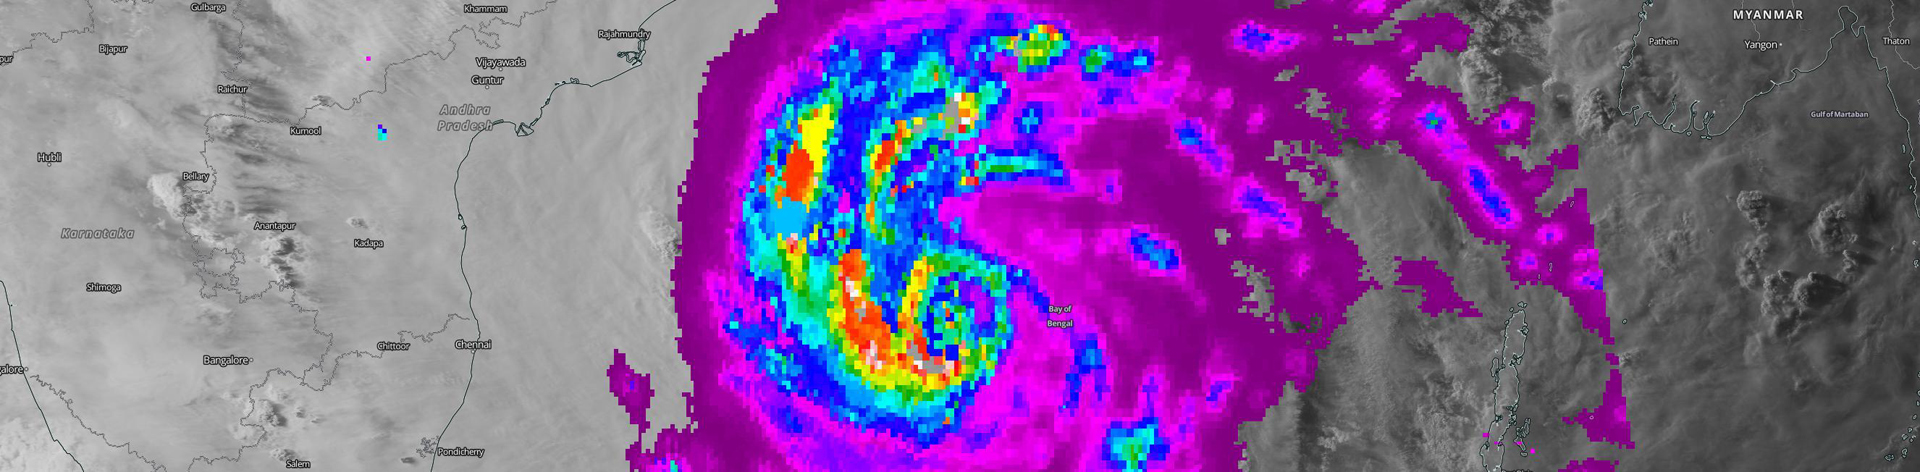
Near Real-time AMSR2 View of Tropical Cyclone Amphan - June 2020
This image shows near real-time surface rain rate sensed by the Advanced Microwave Scanning Radiometer (AMSR2) aboard the Japan Aerospace Exploration Agency Global Change Observation Mission-Water (GCOM-W1) satellite. Colors indicate rain rate: Purple = <0.5 mm/hour; Red = ≥20 mm/hour. Near real-time AMSR2 data are available through NASA’s Global Hydrology Resource Center Distributed Active Archive Center (GHRC DAAC) using the HyDRO search and order tool. Near real-time AMSR2 data also are available through NASA’s Land, Atmosphere Near real-time Capability for EOS (LANCE).
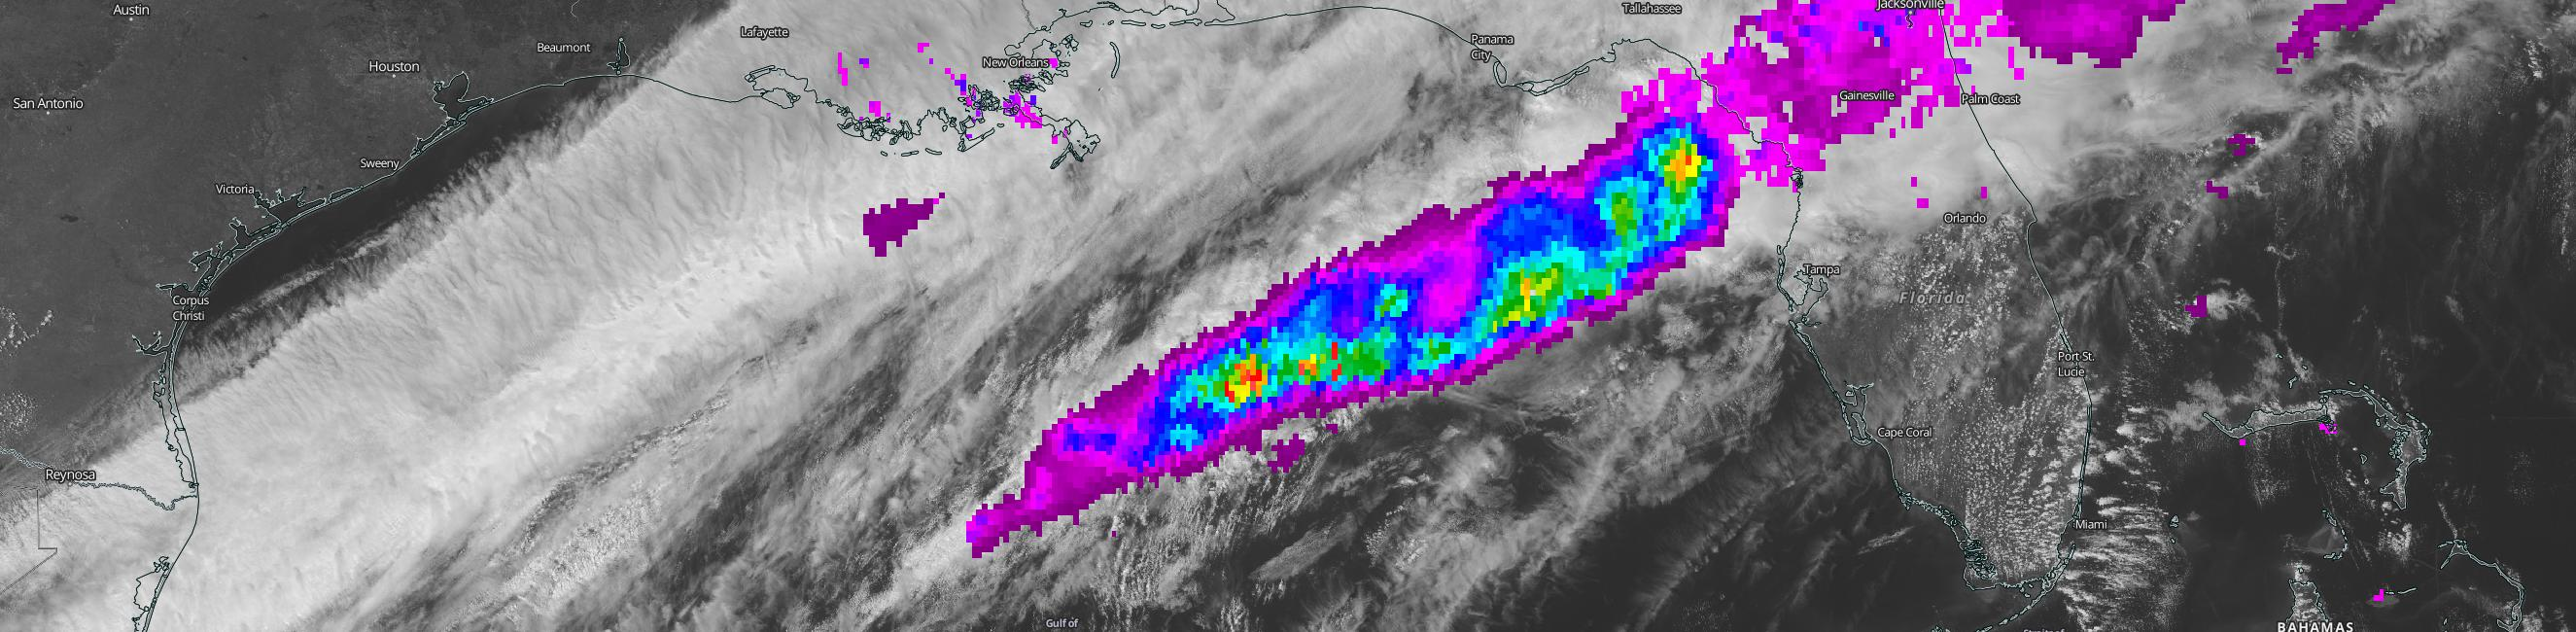
Heavy Precipitation in the Gulf of Mexico - March 2020
This image shows surface precipitation rate (day) as sensed by the Advanced Microwave Scanning Radiometer 2 (AMSR2) instrument aboard the Japan Aerospace Exploration Agency Global Change Observation Mission-Water (GCOM-W1) satellite. Red indicates precipitation of 20 to more than 22 mm/hour. NASA’s Global Hydrology Resource Center Distributed Active Archive Center (GHRC DAAC) archives NASA hazardous weather data. GHRC DAAC is a joint venture of NASA’s Marshall Space Flight Center and the Information Technology and Systems Center (ITSC) at the University of Alabama in Huntsville.
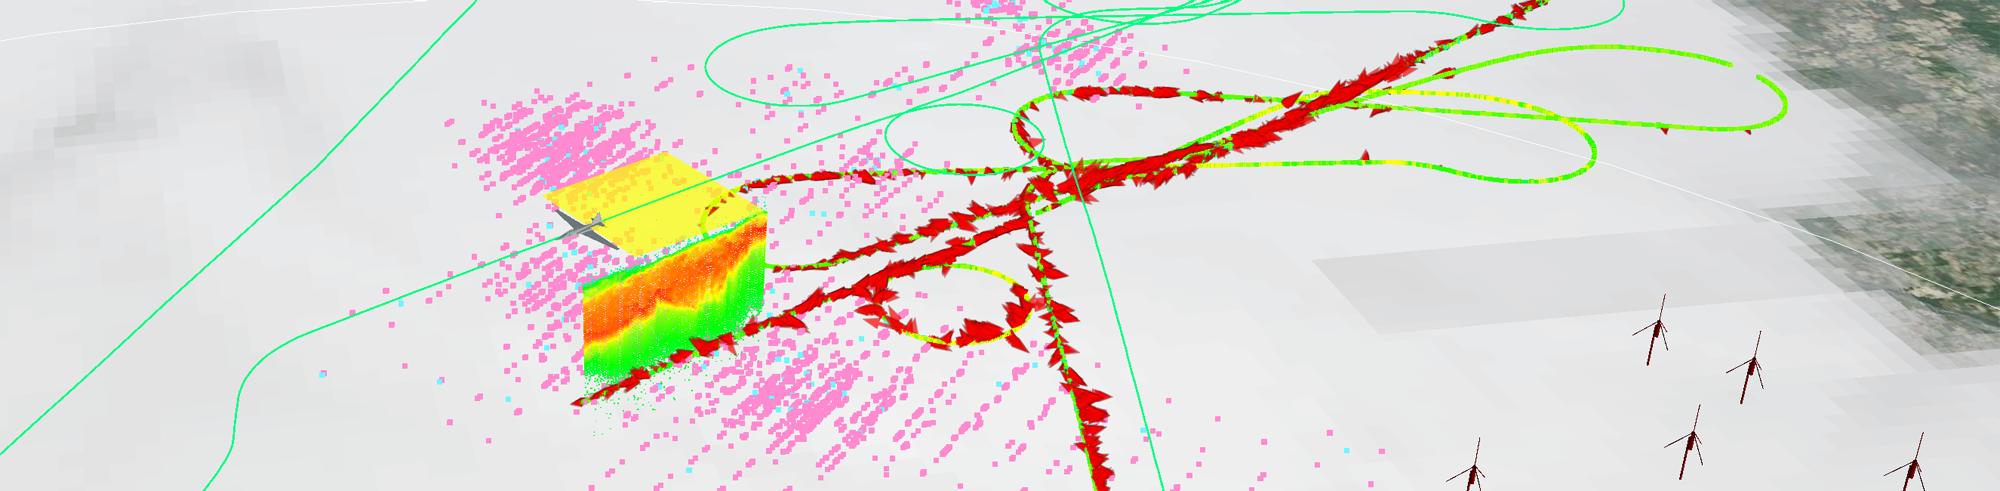
The GOES-R Post-Launch Test Field Campaign - December 2019
This image is from the GHRC DAAC Field Campaign Explorer, a cloud-native 3D visualization and analysis tool. Shown are: electric field (red arrows), aircraft track (green lines), Geostationary Lightning Mapper (GLM) simulator (yellow box), nadir radar (vertical profile), and GLM events (pink dots). GHRC DAAC archives data from the GOES-R Post Launch Test (PLT) Field Campaign conducted March to May 2017. These data were used to calibrate and validate datasets for the Advanced Baseline Imager (ABI) and Geostationary Lightning Mapper (GLM) aboard the joint NASA/NOAA GOES-R satellite.
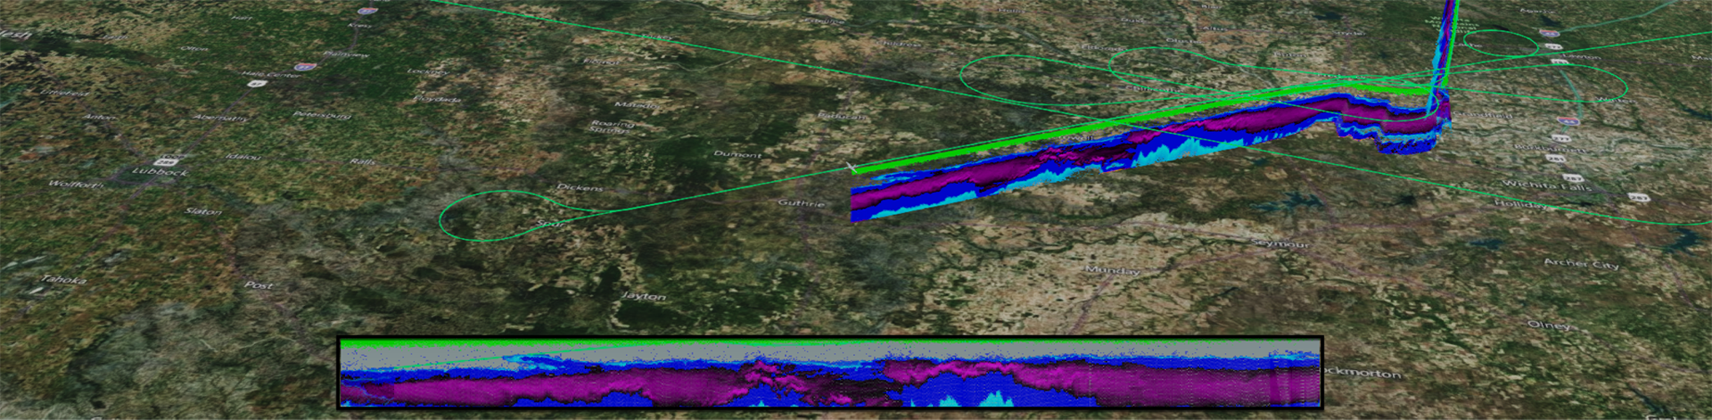
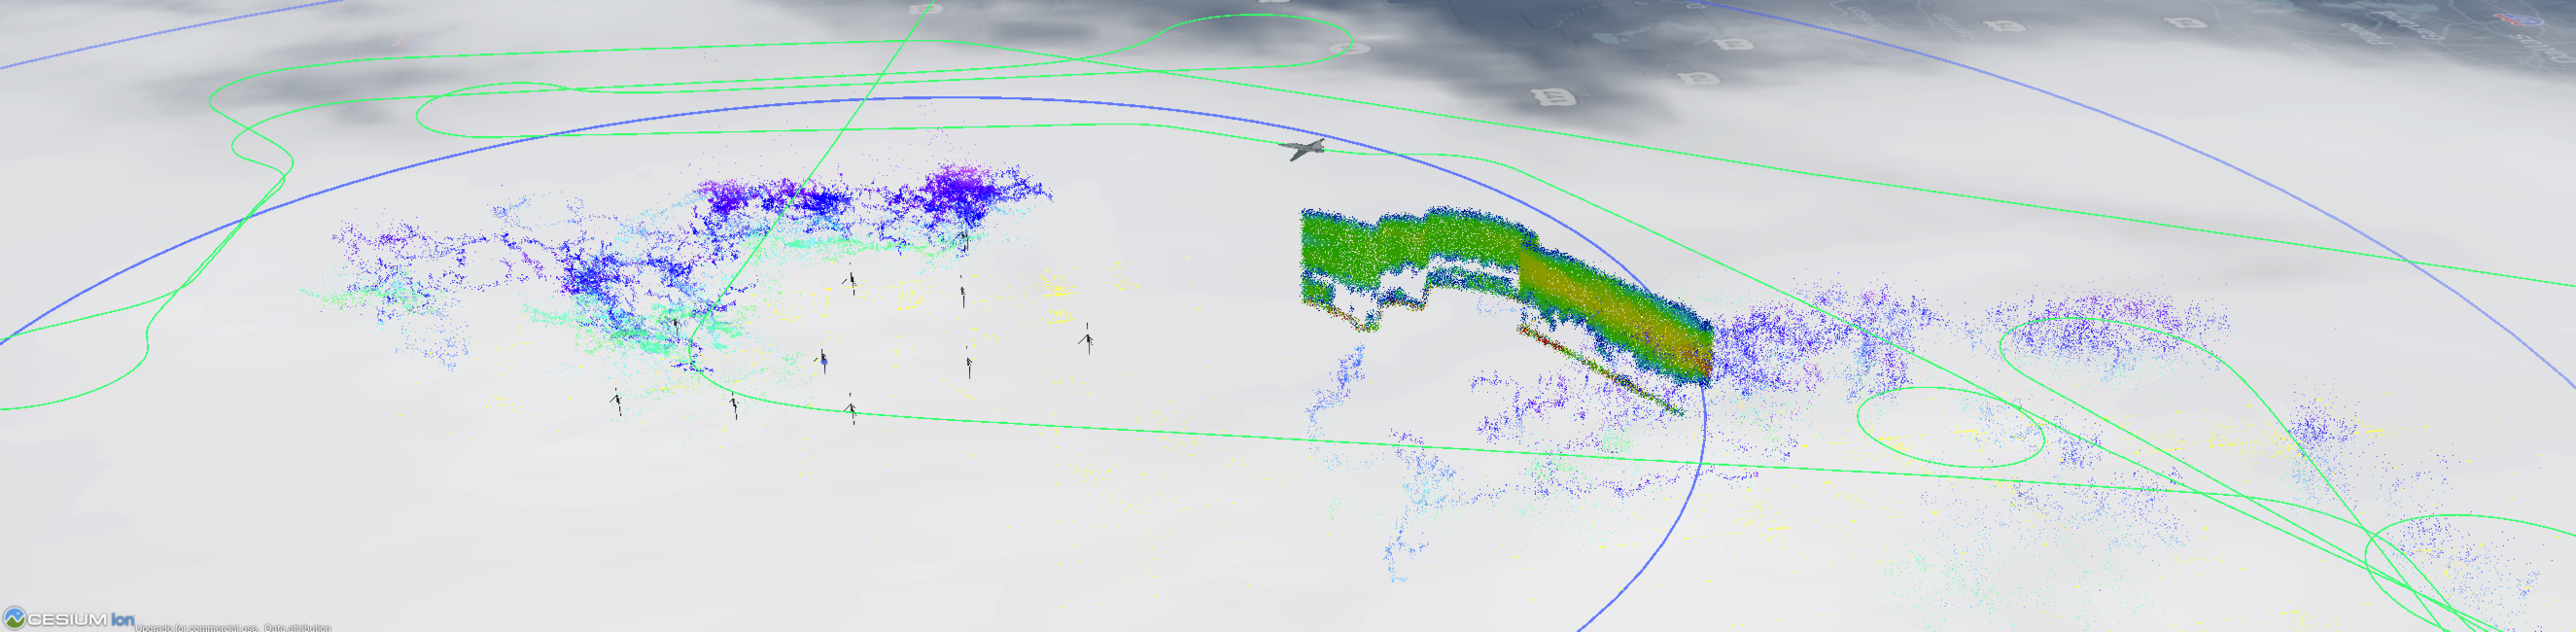
ER-2 Aircraft/Cloud Radar System (CRS) - September 2019
The colored strip of 3D data along the green aircraft flight track are from NASA’s Cloud Radar System (CRS). CRS data are observations of aerosols and convective storms, and supported the GOES-R Post Launch Test (PLT) field campaign. Inset image at bottom is the same CRS data in 2D. Ground validation field campaigns are integral components of satellite missions, and ensure that data collected by satellite-borne instruments are providing accurate data. NASA’s GHRC DAAC archives and distributes data from numerous field campaigns designed to validate precipitation and storm data.
Lightning over Africa - June 2019
This image shows 11 minutes of Lightning Imaging Sensor (LIS) observations during a pass of the ISS the evening of 9 May. The gray swath is the ISS orbital path and the colored dots indicate lightning flash density per minute per square kilometer (blue/green = 1 to 5; yellow/red/pink = 10 to >100). LIS near real-time (NRT) data are available through NASA’s Land, Atmosphere Near real-time Capability for EOS (LANCE) system. LIS NRT data are available within two minutes of observation. These data can be used for lightning-atmosphere interaction studies and severe storm detection and analysis.
Arizona Snow and Cold Snap - January 2019
In early January 2019, a winter storm hit Arizona causing rare snowfall in the desert and the Grand Canyon. The image shows where snow water equivalent values were observed from the snowpack. Values are higher as the colors get deeper. The water content in the snowpack is measured by the Advanced Microwave Scanning Radiometer 2 (AMSR2). This instrument captures near real-time snow water equivalent measurements with data available within 3 hours of observation.
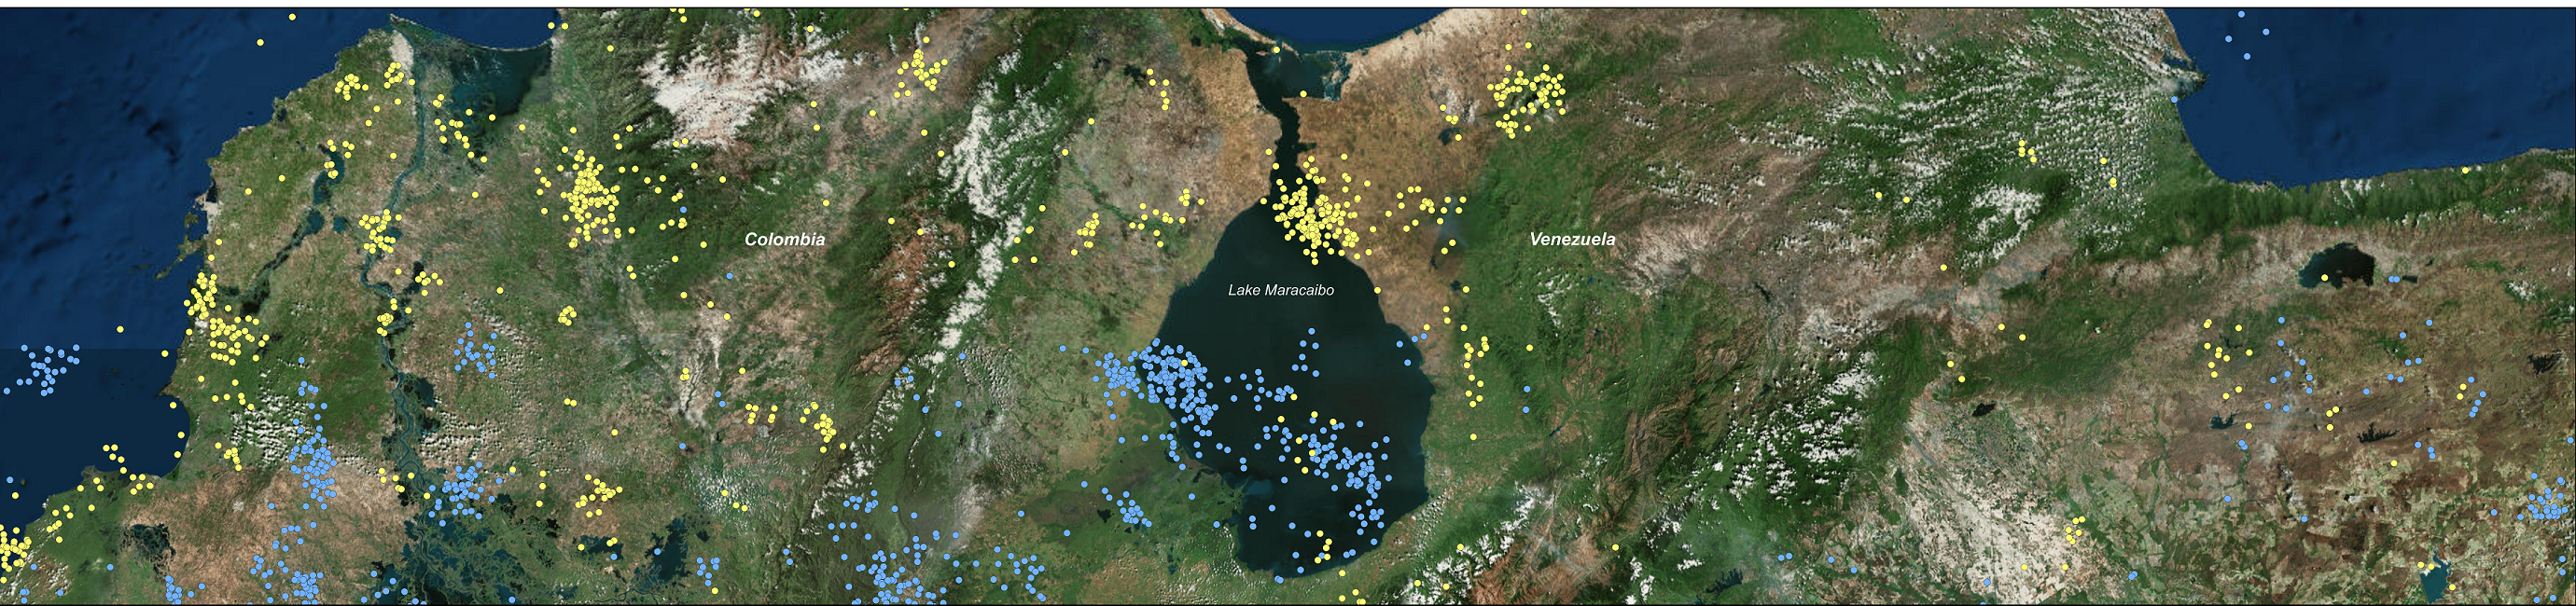
Lightning over Lake Maracaibo - November 2018
Lightning over Lake Maracaibo, Venezuela is more prominent during the night (blue dots) than during the day (yellow dots) due to offshore winds converging over warm water. Image was created using ISS LIS Science Data available at the NASA GHRC DAAC.
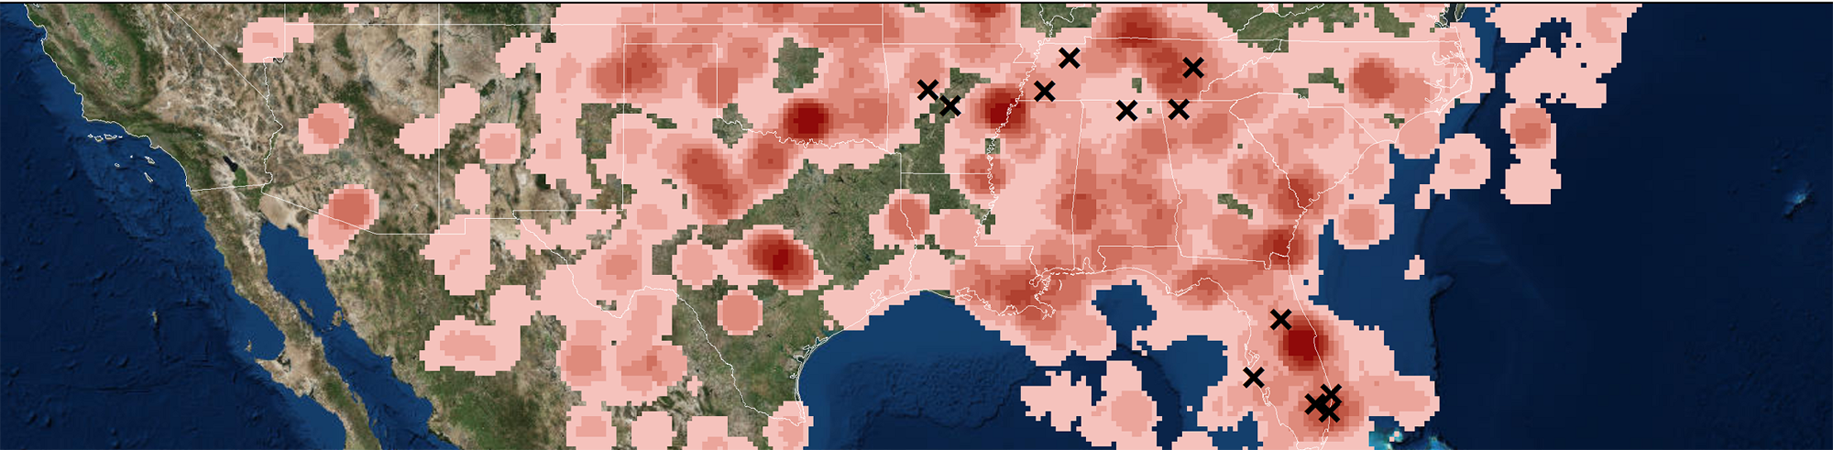
Lightning Safety - August 2018
This Lightning Flash Density image was constructed in ArcGIS with ISS LIS data from May to July 2018. Regions of darker red indicate a higher number of lightning flashes from thunderstorms in that area over the summer. Lightning happens year-round, but most fatalities occur in the summer. June and July have the greatest numbers. The 2018 total for May 1 to July 20 is 13 fatalities (shown here as X’s). Florida has the most with 5 fatalities, followed by Tennessee with 3.
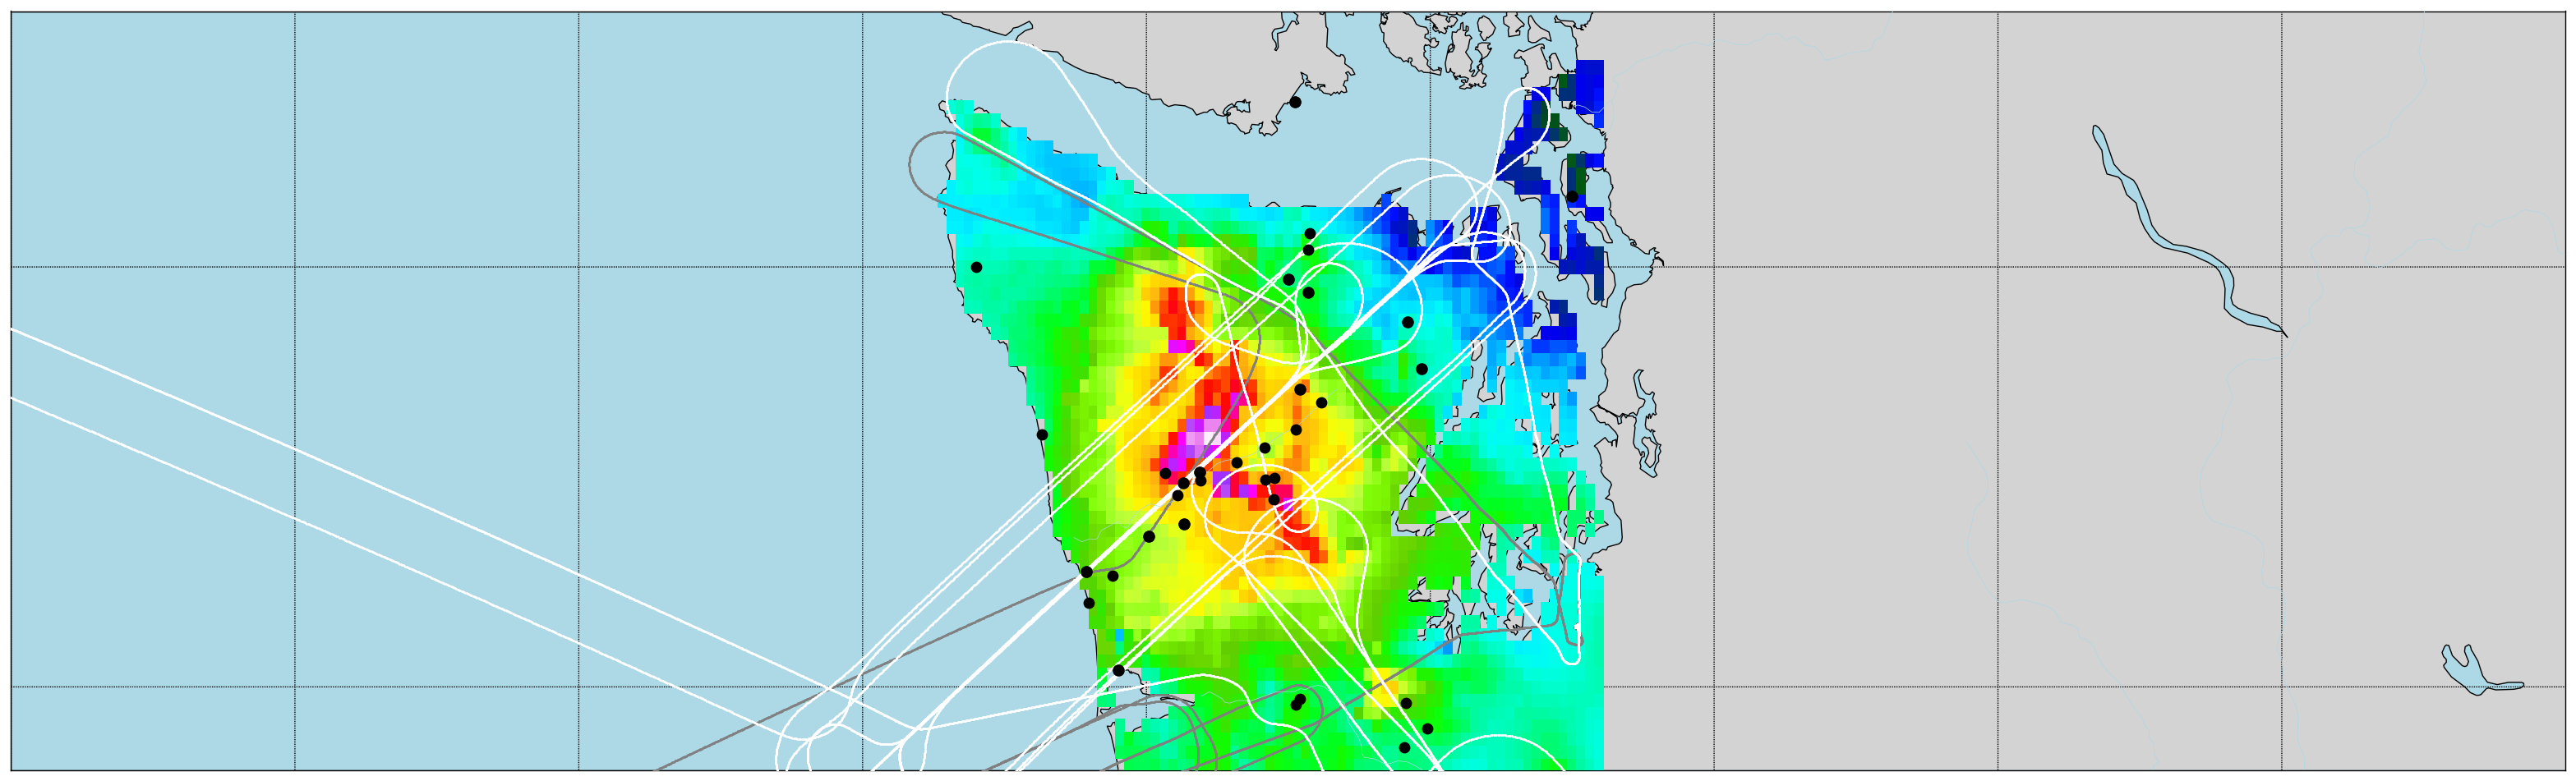
Atmospheric River Study During the OLYMPEX Field Campaign - May 2018
On Dec. 8, 2015, an atmospheric river hung over the Olympic Mountains, resulting in heavy precipitation (up to 24 cm) on the windward ridges as observed by the instruments and shown in this Reconstructed Precipitation dataset.
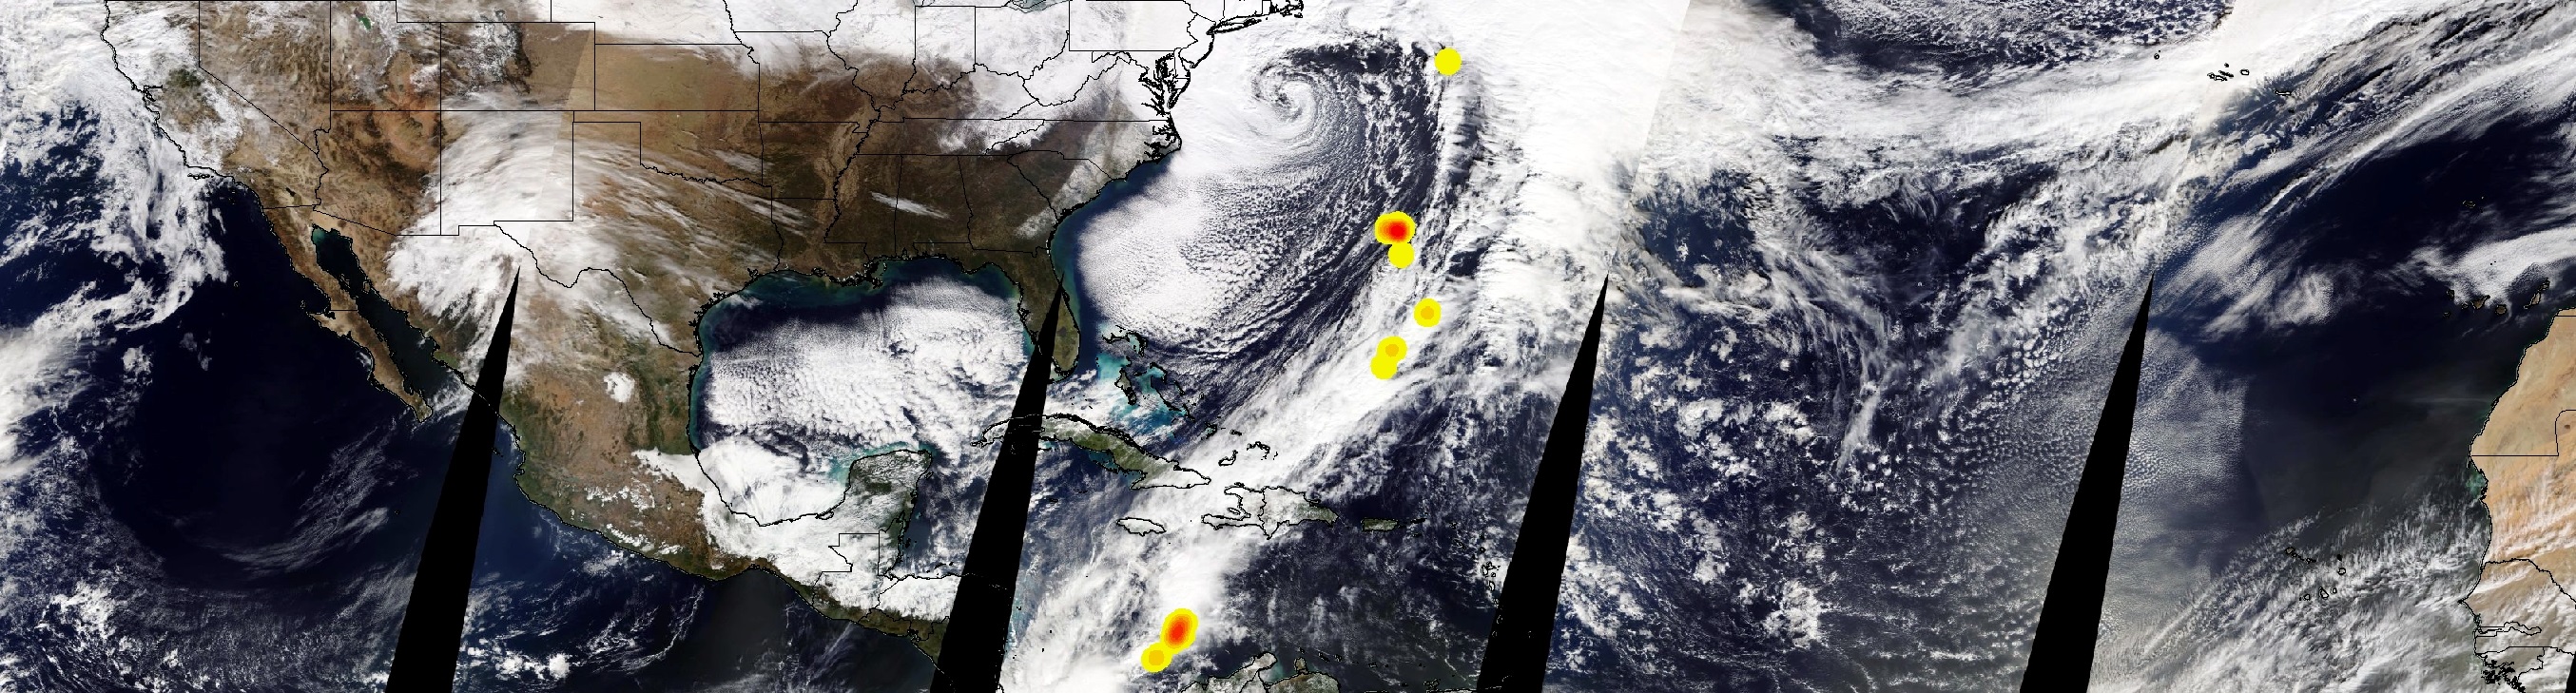
Bombogenesis - January 2018
Explosive intensification of mid-latitude cyclones is sometimes referred to as bombogenesis or a bomb cyclone. On Jan. 4, 2018 a bomb cyclone brought hazardous winter weather to the U.S. East Coast and generated lightning that was observed from space.
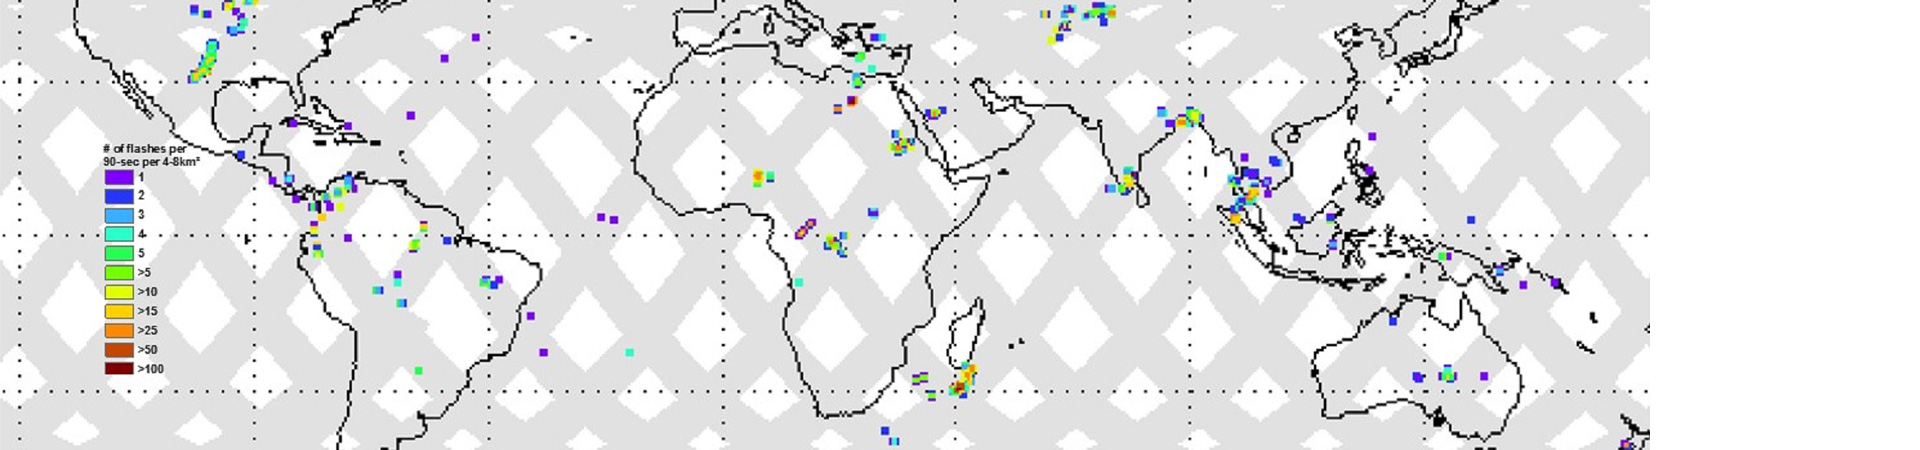
Lightning Imaging Sensor (LIS) on International Space Station (ISS) Science Data - October 2017
On May 17, 2017, severe storms swept through central United States during the evening hours producing EF-0 and EF-1 tornadoes, as well as hail, wind damage, and lightning. The ISS LIS Beta data here shows a series of lightning strike in central U.S. Lightning measured within cyclone Enawo as it slammed into Madagascar showing daily totals in excess of 100 flashes. Enawo was the most severe to hit Madagascar in the last decade, killing more than 80 people and leaving about 247,000 homeless.
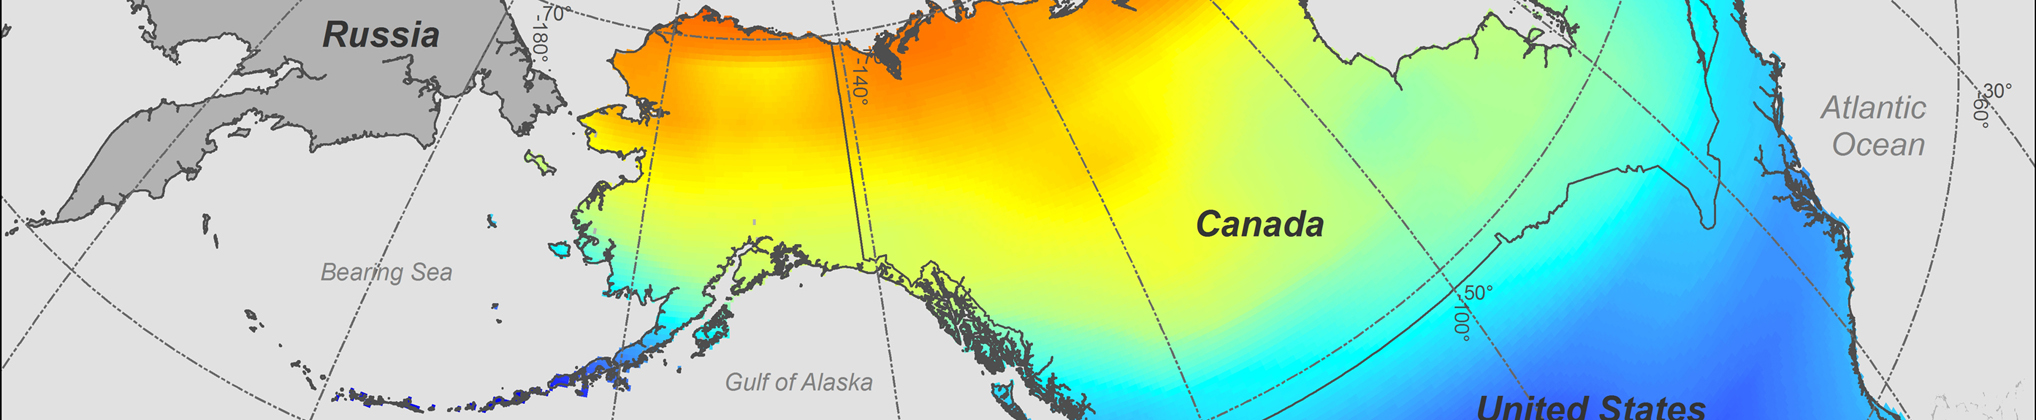
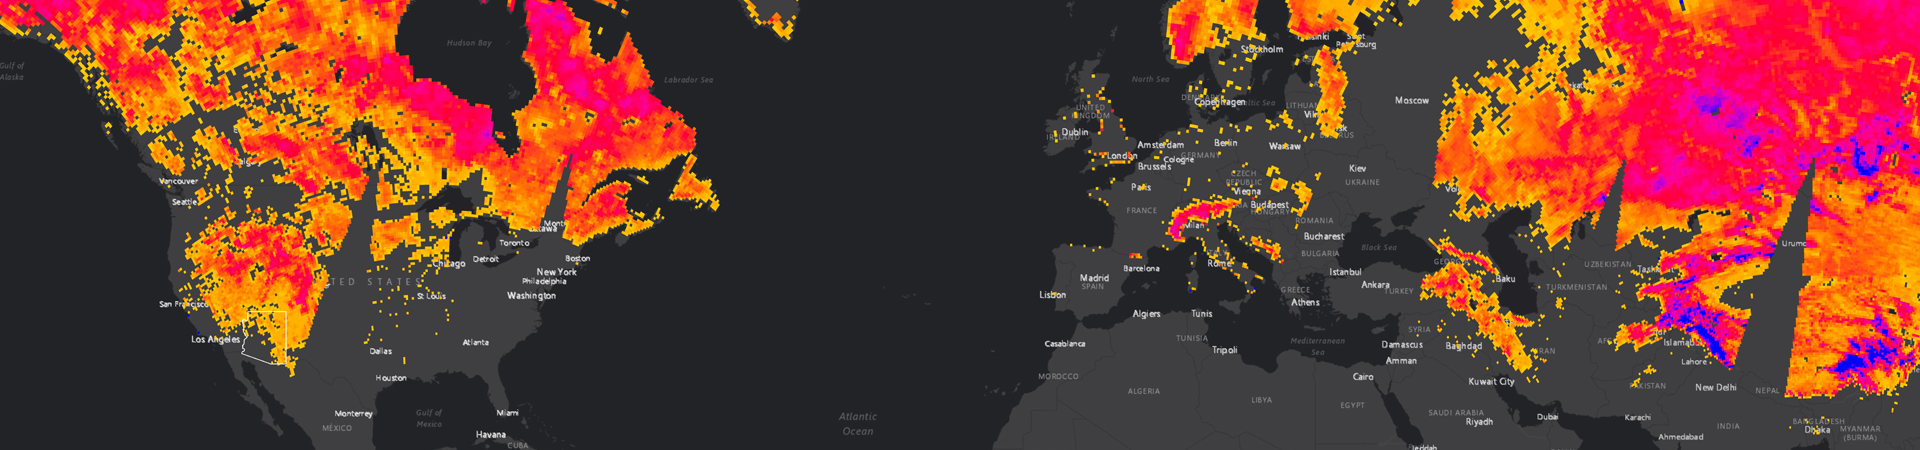
AMSU/MSU LowTropo Day/Month Temp Anomalies and Annual Cycle - May 2017
Higher than normal temperatures were observed across the state of Alaska in 2016 during which several average temperature records for the state were broken. The data collected for 2016 show these high temperature anomalies in Alaska, where the warmer colors indicate higher than normal temperatures. These data capture low troposphere temperature variations observed by the Advanced Microwave Sounding Unit (AMSU) and Microwave Sounding Unit (MSU) instruments. These measurements were combined to provide a global record of temperature fluctuations from 1978-present.
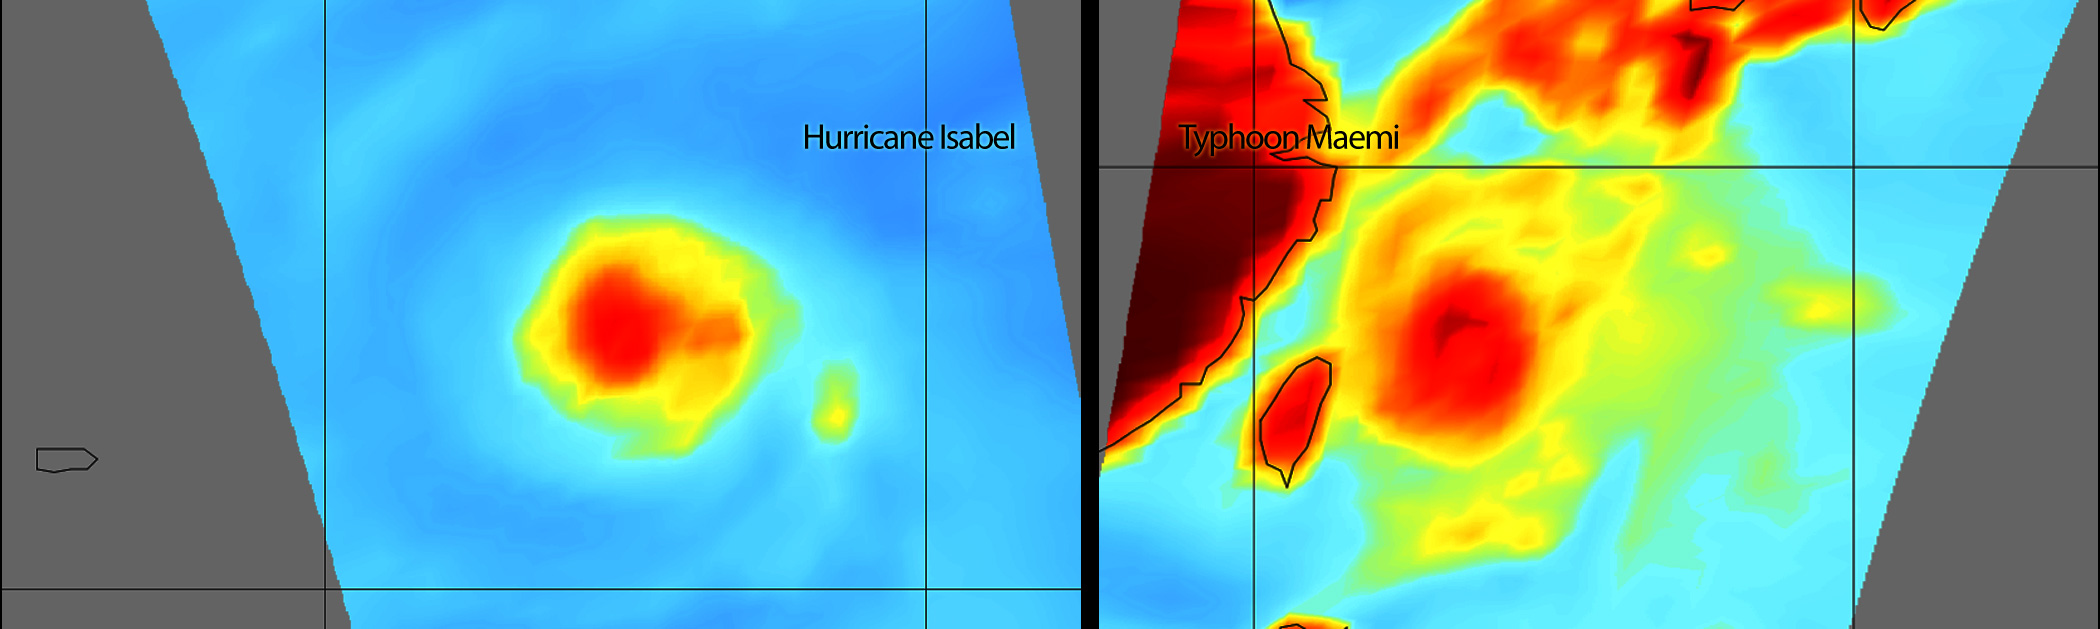
Advanced Microwave Sounding Unit-A (AMSU-A) Swath from NOAA-17 - February 2017
Hurricane Isabel NOAA-17 AMSU-A image on September 11, 2003 shows storm at peak intensity (Category 5 - winds > 165 mph). Isabel made landfall in North Carolina 5 days later causing over $7 billion in damages and 16 deaths throughout 6 states. Typhoon Maemi, a powerful typhoon that hit South Korea caused almost $5 billion in damages and 120 fatalities in 5 different countries. This NOAA-17 AMSU-A image from September 11, 2003 shows Maemi as a Category 5 storm. Although both storms look similar in these images, they vary greatly in intensity and resulting damage.
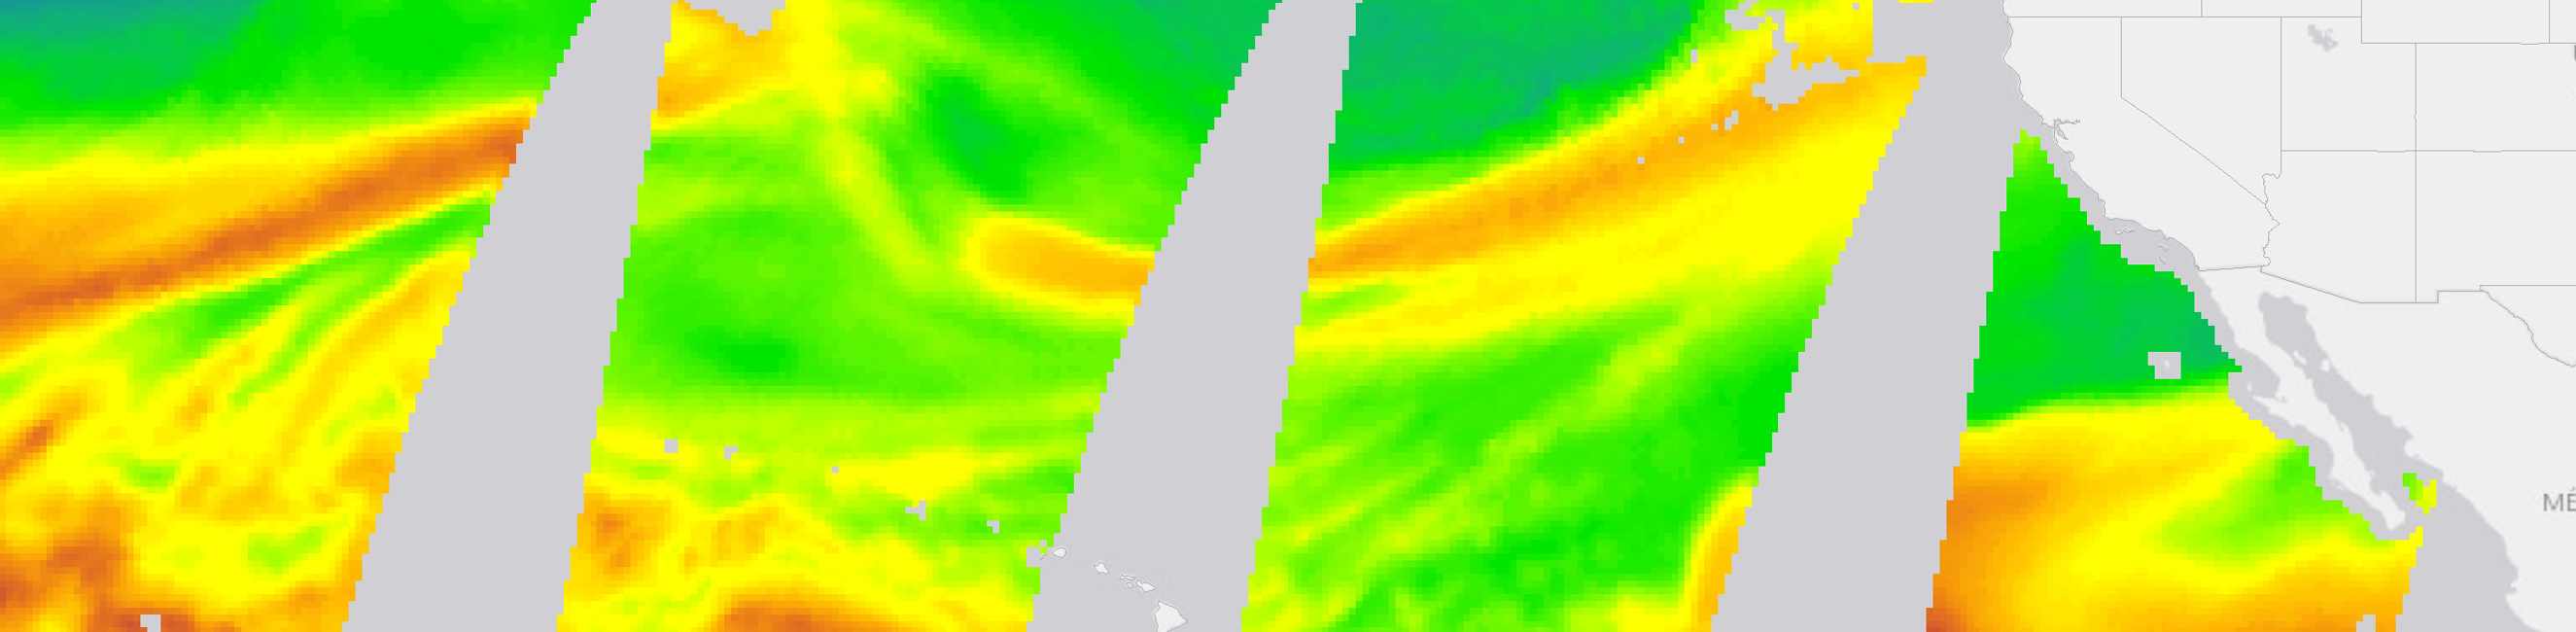
Atmospheric River seen by RSS SSMIS Ocean Product Grids - December 2016
On Oct 13-14, 2016 Crescent City had over 5 inches of rain during one atmospheric river event leading to the second wettest October on record with over 4 times the typical October amount. This event was enhanced by the remnants of Typhoon Songda. Atmospheric rivers are narrow regions of high water vapor that are visible in passive microwave imagery such as the F17 SSMIS data from GHRC shown here. Just a few strong events each year can deposit as much as 50% of the annual precipitation as heavy rain with flooding.
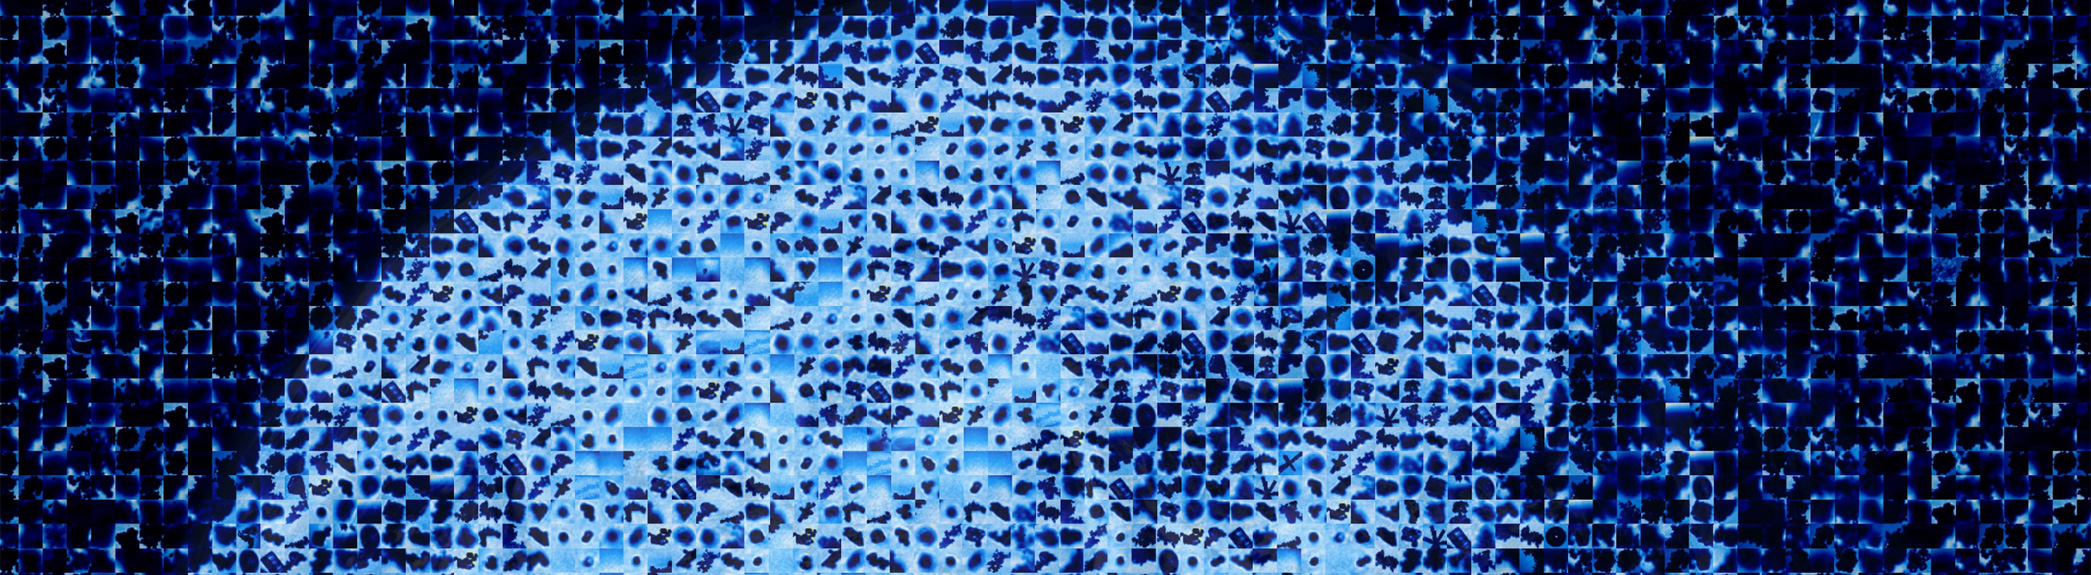
Water Makes the World - June 2016
This mosaic was created using images of liquid and frozen cloud particles taken during the Mid-latitude Continental Convective Clouds Experiment (MC3E). MC3E was a NASA Global Precipitation Measurement (GPM) ground validation field campaign to validate data collected by the joint NASA/Japan Aerospace Exploration Agency GPM satellite mission.
Clouds contain both liquid (rain) and frozen water (ice crystals). Rain drops in clouds are not teardrop shaped, but are shaped more like hamburger buns. Similarly, ice crystals in clouds do not always resemble typical snowflakes. Frozen water takes on a variety of hexagonal shapes called habits, which rarely are perfectly shaped.
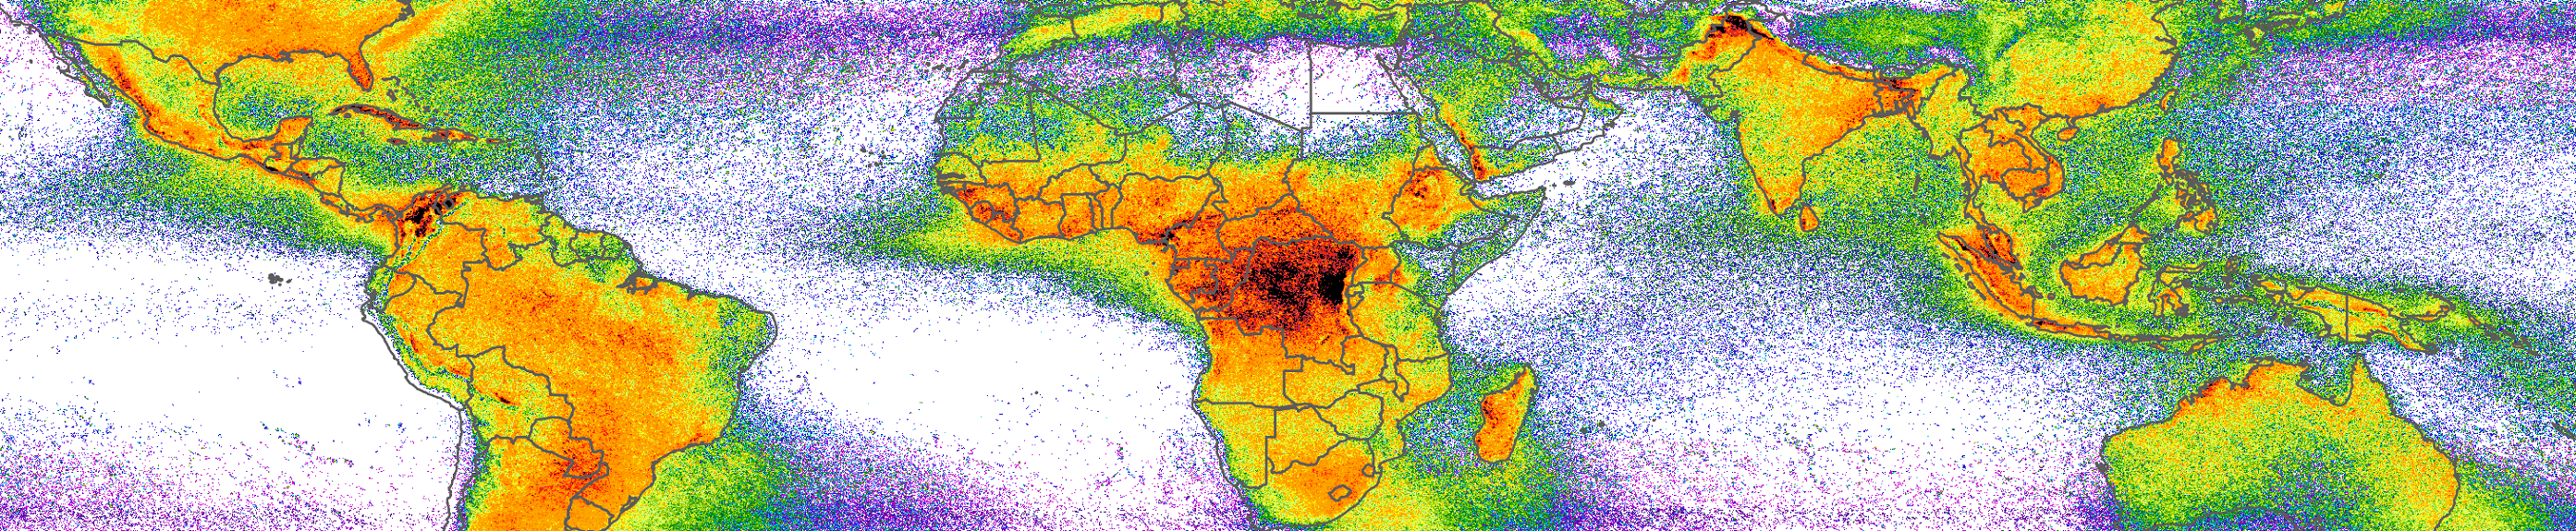
LIS Very High Resolution Climatology - March 2016
The lightning climatology reveals Earth’s peak lightning hotspot to be located over Lake Maracibo in Venezuela. This area experiences very localized and persistent thunderstorms, which accounts for the observed high flash rate density. The LIS Very High Resolution Climatology datasets were derived from 16 years of lightning observations collected by the Lightning Imaging Sensor (LIS). This data presents a higher resolution gridded lightning climatology dataset than previously available, allowing lighting trends and hotspots to be studied.
Have you used our data? Register for updates
