HS3 HIWRAP Radar Reflectivity Profile Quick View
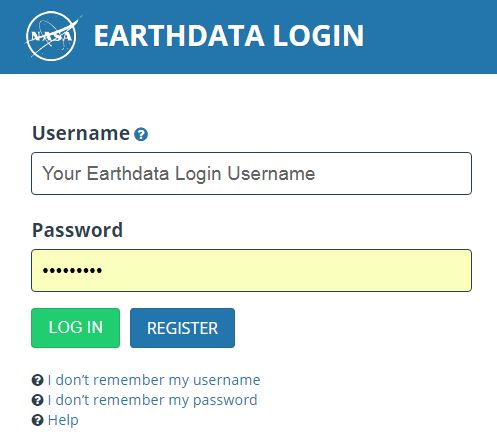
The Hurricane and Severe Storm Sentinel (HS3) airborne field campaign used the High-Altitude Imaging Wind and Rain Airborne Profiler (HIWRAP) instrument to collect wind and precipitation measurements. This data recipe enables users to generate a time-height plot of the measured HS3 HIWRAP radar reflectivity through a Python plotting routine. The Python routine requires users to define the GHRC OPENDAP path to a data file and measured variable of interest. This data recipe then plots the data to provide a quick visualization of radar reflectivity. To run this Python routine, a pre-installed version of Python and additional Python packages are required. Advanced users may alter the code to plot other HS3 HIWRAP data variables.

| Data Recipe Type | |
|---|---|
.png) | |
| Data Visualization | |
| TYPE | ACCESS | ||
|---|---|---|---|
|
| Python Script |
| Open Source |
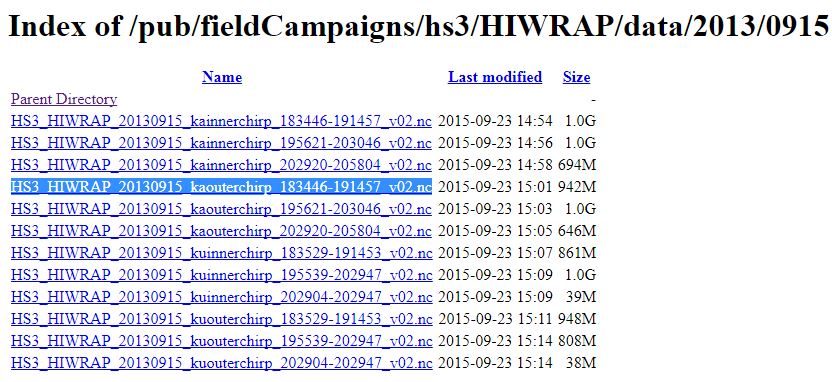
Within the Python script, to change the default data file to the one you want to use, simply paste your file name in the "datafile" variable in the region highlighted below. Make sure to update the OPeNDAP URL path to reflect the year and day of the data file in the OPeNDAP path.

Within the “Set Parameters” portion of the code, there are two variables for defining the final plot font sizes. To change the font size of the plot labels, you may alter the “pltlbl_size” variable in the area highlighted.

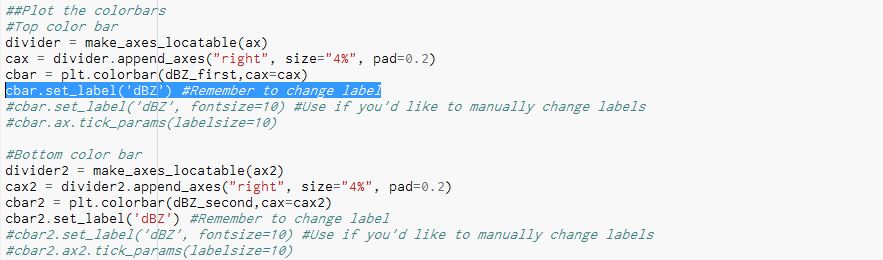
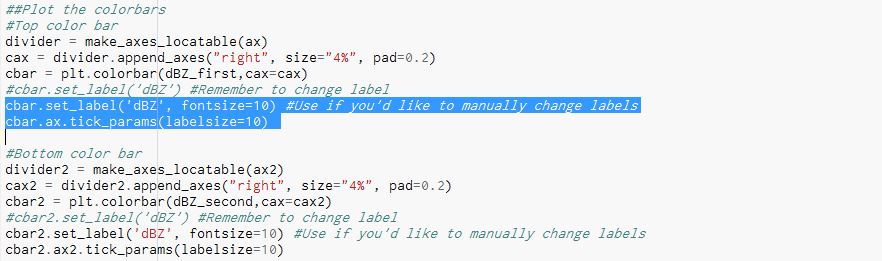
To change the font for the rest of the plot (e.g. axis font, color bar etc.) change the font size within the matplotlib parameters highlighted below.

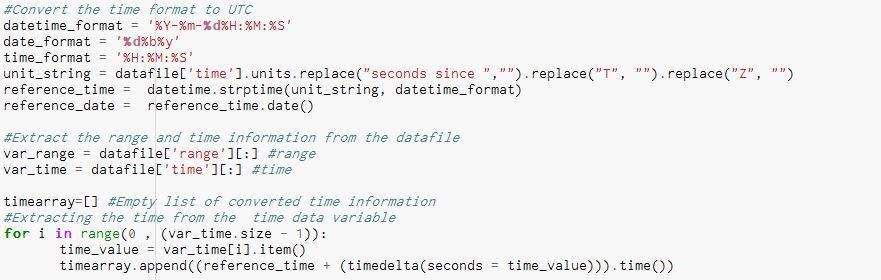
Within the data file, the time field is defined in hours since the beginning of a given flight on a given date. For the data file used in this data recipe, the start time is 00:00 UTC on October 17, 2014. To make this information more readable, the next portion of the code reformats the time field so that the time is shown in standard UTC time on the final plot. You do not need to make an alterations to this section.
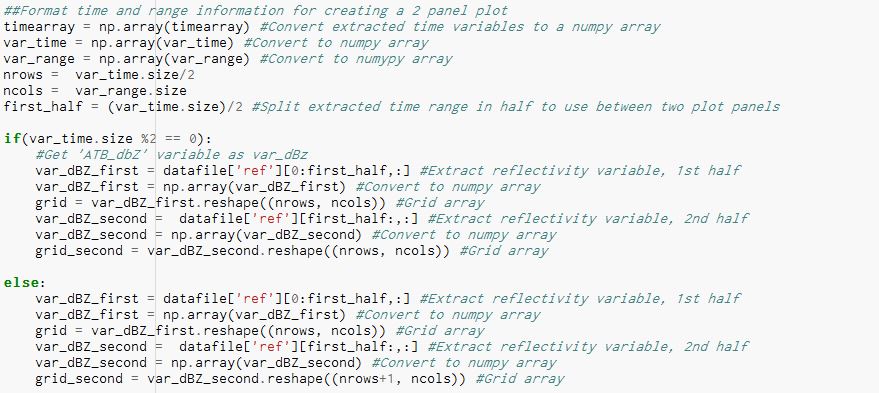
Once the time is formatted, the array of values containing the radar reflectivity in dBZ and associated time and range information is split in half to generate two separate panel plots.

To create the final plot, simply run the code and the generated plot shown below should appear.
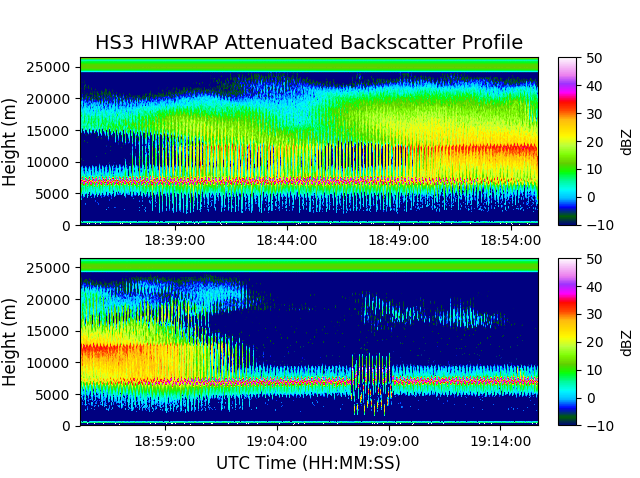
Please note that this Python script may be reused and altered to plot additional HIWRAP data variables. This plot has not undergone any quality control measures, so additional alternations are needed for scientific use.
| Dataset Name | Hurricane and Severe Storm Sentinel (HS3) High-Altitude Imaging Wind and Rain Airborne Profiler (HIWRAP) |
| Platform | Global Hawk UAV |
| Instrument | High Altitude Imaging Wind and Rain Airborne Profiler (HIWRAP) |
| Science Parameter | Radar Reflectivity |
| Format | NetCDF-4/CF |
| Data Information |
|
| Variable | Description | Dimension | Units | Scale Factor |
|---|---|---|---|---|
| time | UTC time | 1D | hours (since start of flight) | none |
| range | Range from radar | 1D | meters | none |
| ref | HIWRAP radar reflectivity | 2D | dBZ | none |

Dec 2nd, 2022