Infrared Global Geostationary Composite Quick View
The Aviation Weather Center (AWC) Infrared Global Geostationary Composite dataset contains global infrared composites retrieved from a series of polar and geostationary satellites. These mosaics of global infrared data are made available in AREA McIDAS format. This data recipe provides instructions on how to use a Python script to convert Infrared Global Geostationary Composite McIDAS data into PNG format and display the infrared composite as an image outside of McIDAS software. This data recipe requires a pre-installed version of Python, a downloaded Infrared Global Geostationary Composite data file (AREA), and the Python matplotlib package.

| Data Recipe Type | |
|---|---|
| Data Visualization | |
| TYPE | ACCESS | ||
|---|---|---|---|
|
| Python Script |
| https://gitlab.c… |
This data recipe uses the Infrared Global Geostationary Composite dataset. More information and additional resources about this dataset can be accessed here.
To follow along with the steps below, pre-install Python and the matplotlib Python package on your computer to display the data in PNG format.
Download and save this script to your computer.
Once your account has been created, you can download a AREA McIDAS file of your choice by simply following this link.
Once you have downloaded the data, save the files to a folder where you will work from.
Open the Python environment installed on your computer and make sure the required Python package outlined in the “How to Use” section is installed.
Open the Python script downloaded from the GHRC Github within your Python environment.
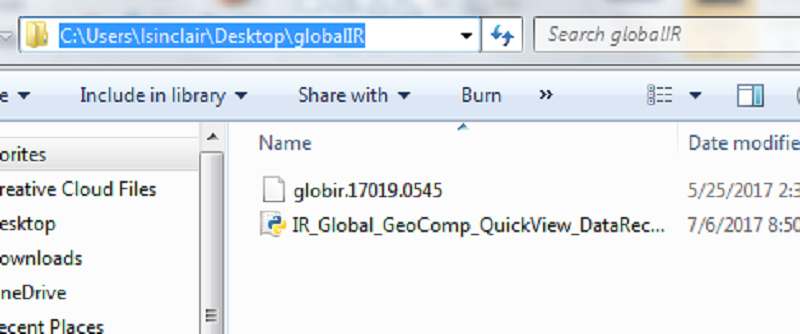
Navigate to the folder on your computer where you have saved the Infrared Global Geostationary Composite AREA McIDAS file. From the address bar, copy the file path as shown below:
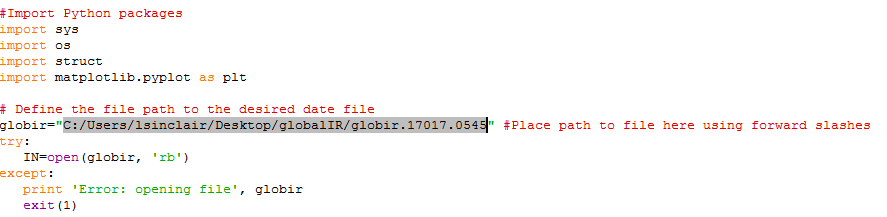
Paste the file path within the quotation marks for the variable “globir” highlighted in grey below. For Python, the backslashes need to be changed to forward slashes. At the end of the file path after the last forward slash, add the filename of the Infrared Global Geostationary Composite file as shown.
For this data recipe, documentation is provided in the Python code to outline what each section performs. The code first extracts the data’s header and navigation information and array size, then proceeds to extract the data parameter in the AREA McIDAS file needed to create the PNG file image. Using this information the code proceeds to construct a one-dimensional array and then sets up and reshapes it into a two-dimensional array for plotting. Finally, the code uses the matplotlib module to plot the two-dimensional array and save it as a PNG file to the same folder where the code is located on your computer.
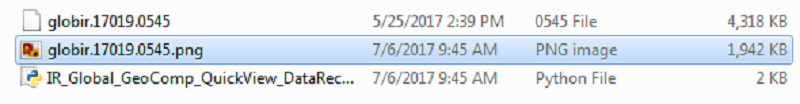
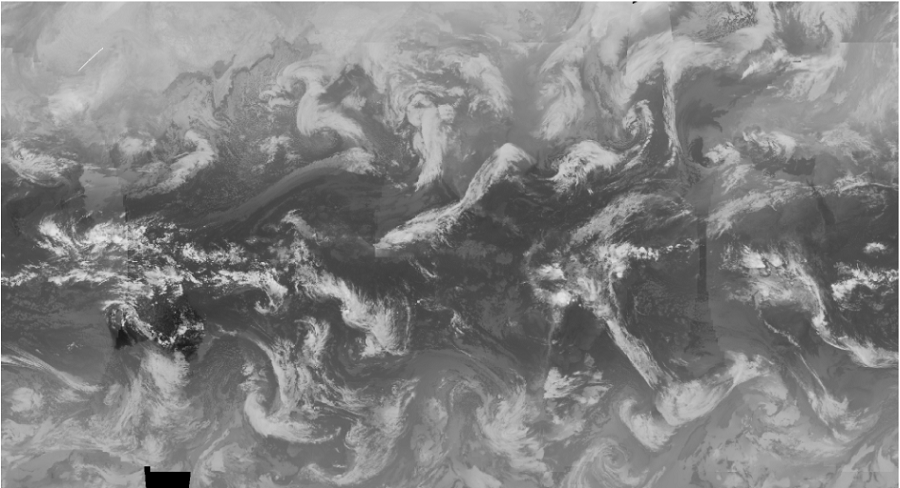
Double-click on the PNG file to view the Global IR composite image.
| Dataset Name | Infrared Global Geostationary Composite |
| Platform | GMS-4, GOES-11, GOES-12, GOES-8, GOES-9, METEOSAT-6, METEOSAT-7, METEOSAT-9, MTSAT-1R, NOAA-15, NOAA-16, NOAA-17 |
| Instrument | AVHRR, GOES-11 IMAGER, GOES-12 IMAGER, GOES-8 IMAGER, GOES-9 IMAGER, VISSR |
| Science Parameter | Infrared Wavelengths |
| Format | McIDAS |
| Data Information |
|
| Variable | Description | Dimension | Units | Scale Factor |
|---|---|---|---|---|
| Infrared Wavelengths | The infrared channel shows the temperature of the clouds. The higher clouds are colder and show up as white, while areas with no clouds show up as darker shades of gray to black. | 2D | n/a | None |

Dec 1st, 2022