RSS DMSP SSM/I and SSMIS Gridded Ocean Product Quickview
The Remote Sensing Systems (RSS) gridded DMSP satellite Special Sensor Microwave Imager (SSM/I) and Special Sensor Microwave Imager/Sounder (SSMIS) ocean data products provide aggregated information of ocean properties at several time scales. This data recipe instructs users on how to plot and visualize variables stored with the RSS DMSP gridded time-averaged ocean products using a Python plotting routine. In this data recipe, the columnar water vapor variable is used to demonstrate how to handle and plot data values within these files. The Python routine requires users to define the OPeNDAP path to a GHRC datafile, a data variable within the file and the data variable quality assessment and scale information. To run this Python routine, a pre-installed version of Python and additional Python packages are required. Advanced users may alter the code to other data variables and tailor the plotting parameters to their liking.
| Data Recipe Type | |
|---|---|
| Data Visualization | |
| TYPE | ACCESS | ||
|---|---|---|---|
|
| Python Script |
| Open Source |
This data recipe uses the RSS SSMIS Ocean Product Grids 3-Day Average from DMSP-F17 netCDF dataset, however this routine may be applied to other time-averaged RSS SSM/I and SSMIS gridded ocean products offered by GHRC. The recipe does not work on the daily files. More information and additional resources about this particular dataset can be accessed here.
This data recipe is available as a Python script. To run the Python script, please install the following Python modules: matplotlib, basemap and netCDF4.
Follow the "Python Script" link on this page to access the GHRC DAAC data-recipe GitHub folder and obtain the RSS DMSP SSM/I Gridded Ocean Product Quickview Python Script titled "SSMI_SSMIS_GriddedOceanProd_Quickview.py".
You can preview the script by clicking the file name. To download, select the green “Clone or download” button located on the right side of the webpage to download the script as a zipped file or to open on your desktop. Save the file to a desired folder location on your computer.
Open the Python environment installed on your computer and make sure the required Python packages outlined in the “How to Use” section are installed.
Navigate to the location on your computer where the data recipe Python file is saved and open the file within your Python environment.
This data recipe uses OPeNDAP to access the GHRC data files so that users do not need to download and save the data files to their computers.
To define the datafile you want to use, navigate to the GHRC RSS SSMIS (or SSM/I) OPeNDAP directory.
The RSS SSMIS and SSM/I data files are organized by DMSP satellite (F08 - F17), temporal average (3-day, daily, monthly, and weekly) and data type (browse, data). This data recipe can be used to plot any of the 3-day, monthly or weekly data products, however the daily files are structured differently and can not be used with this data recipe.
To re-create the example plot shown in this data recipe select the following file path: f17 > 3day > data > 2017 > f17_ssmis_20170904v7_d3d.nc
The URL path will take you to the OPeNDAP Server Dataset Access Form for the selected dataset, which you can access here. You may explore this form to identify the available data variables within this file.
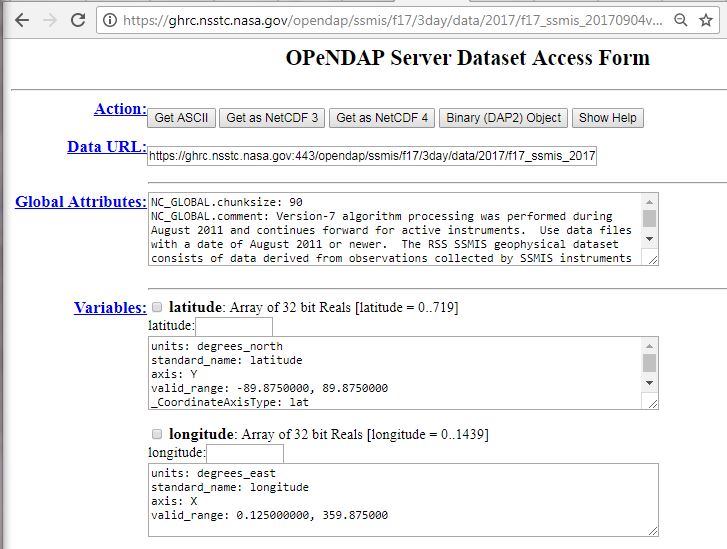
To define the OPeNDAP URL path to your desired data file with the Python script, copy the text in the “Data URL” window.
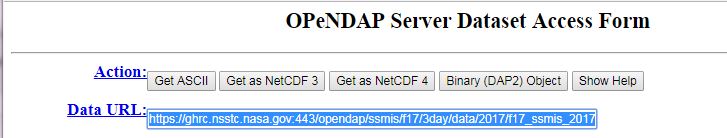
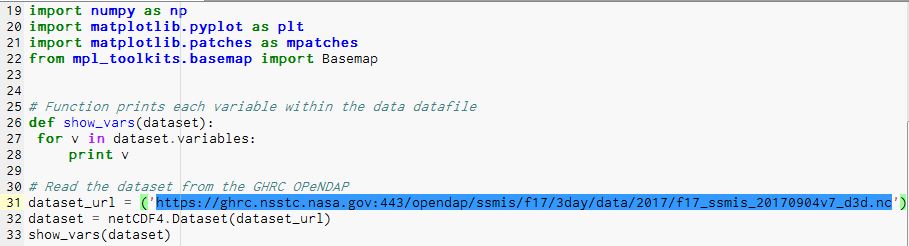
You will then paste the URL text within the variable “dataset_url” as shown below in the highlighted portion of the figure below. Make sure to paste the URL within the quotation marks.

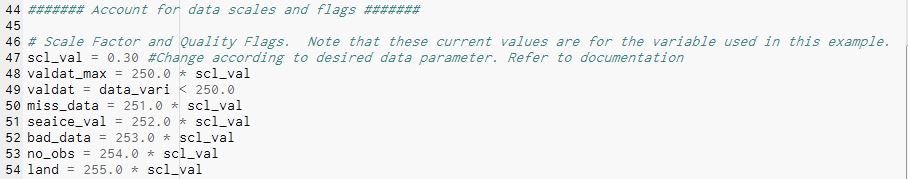
The RSS SSM/I and SSMIS ocean product data files contain certain data value scales to 1) reduce the size of data files and 2) allow users to quality control data values and identify land and sea ice areas within the data. For each of the available data variables in these files, there exists specific scale factors and quality flag information. More information on these variables can be accessed from the dataset landing page. For the water vapor variable, this information has already been coded. If you would like to plot other data variables you may easily alter the existing code.
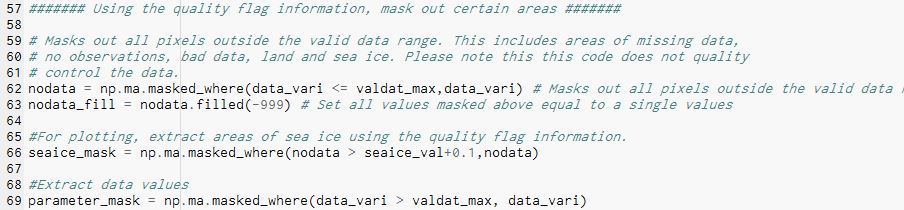
To account for the quality flag information, the defined information in Step 6 is then used to identify and mask out areas of sea ice, land, and bad quality or missing data. This section may be altered to your desired data quality needs.
The final portion of the code contains the formatting information to tailor and generate your plot. Take special note to remember to change the “plt.title” and plt.colorbar” variables to insure you are representing the datafile name and variable units appropriately in your final plot.
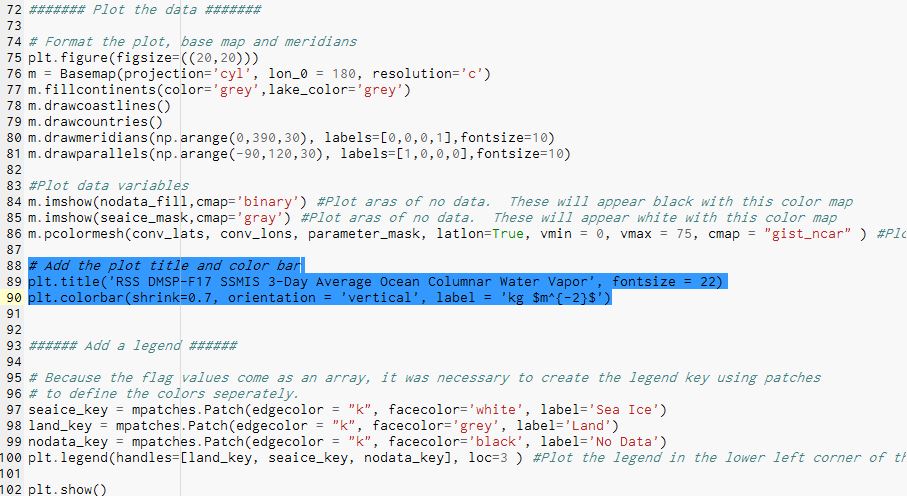
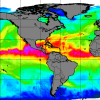
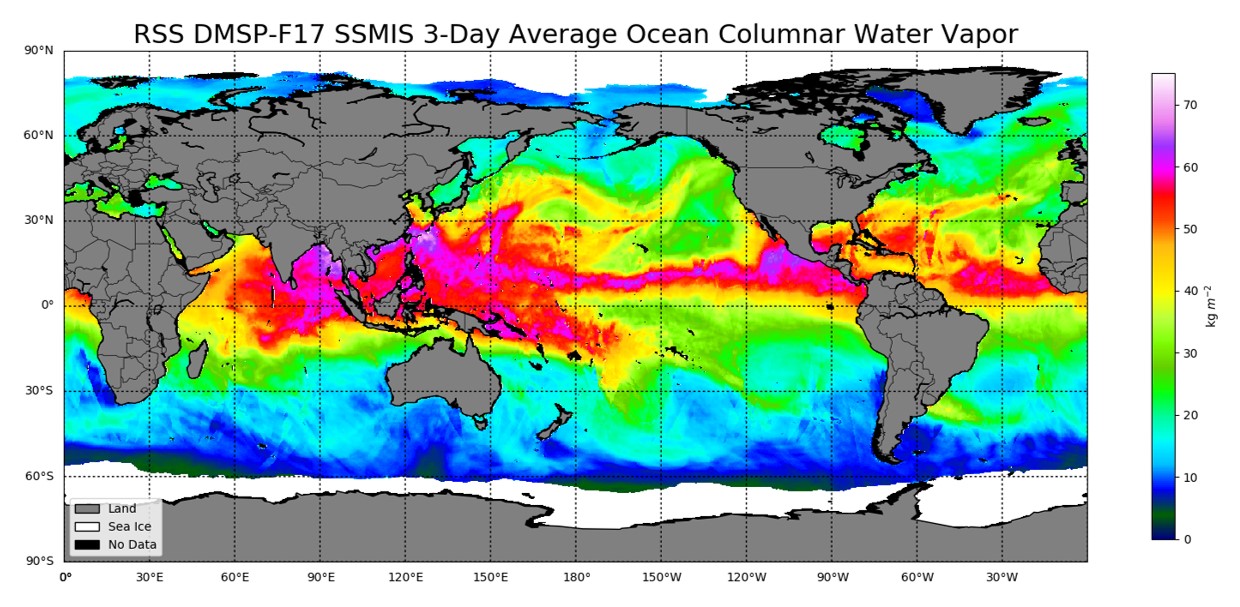
To plot the image, simply run the code and the generated plot shown below should appear.
This Python script may be reused and altered as needed to plot additional data variables not used in this example.
The following datasets may be used with this data recipe with the exception of the daily products: https://search.earthdata.nasa.gov/portal/ghrc/search?q=rss.
| Dataset Name | RSS SSMIS Ocean Product Grids 3-Day Average from DMSP F17 NetCDF |
| Platform | DMSP-F17 |
| Instrument | Special Sensor Microwave Imager/Sounder (SSMIS) |
| Science Parameter | Columnar Water Vapor (atmosphere_water_vapor_content) |
| Format | NetCDF-4 |
| Data Information |
|
| Variable | Description | Dimension | Units | Scale Factor |
|---|---|---|---|---|
| wind_speed | 10 meter Surface Wind Speed | Geo2D | m s-1 | 0.2 |
| atmosphere_water_vapor_content | Columnar Water Vapor | Geo2D | kg m-2 | 0.01 |
| atmosphere_cloud_liquid_water_content | Columnar Cloud Liquid Water | Geo2D | kg m-2 | 0.3 |
| rainfall_rate | Rain Rate | Geo2D | mm hr-1 | 0.1 |

Jan 9th, 2023