Flight 13, Saharan Dust/Dirty Clouds, 05 Sept 2006
November 8th, 2006
Team: Anderson, Winstead, Podolske
Instruments: UHSAS still out of service. We tweaked up/calibrated the PCASP, OPC, SMPS and APS to ensure that we get good size distribution measurements within the anticipated dust layers.
Observations: Models and satellite data products indicated that an extensive dust episode was occurring over the Sahara. The flight plan called for us to fly east at 19 deg latitude to about 10 W to perform remote and in situ sampling of the Saharan Air Layer (SAL). It was hazy, but cloud-free at Sal before takeoff. On accent, we passed through a thin pollution layer at around 5 kft, then climbed through a dust layer that extended from 6 to 16.5 kft. The pollution layer exhibited characteristics similar to the plume we sampled the previous day, with CO of around 120 ppbv and enhanced submicron aerosol scattering. The layer exhibited enhanced O3 mixing ratios, which indicate that it was at least a day or two from its source.
LASE real-time curtain plots showed the dust layer to be a persistent atmospheric feature between Sal and our most distant waypoint at 18 N, 10 W, although they indicated a marked change in dust loading within the boundary layer (
Flight 12, Easterly Wave/Convection, 04 Sept 2006
September 8th, 2006
Team: Winstead, Anderson, Podolske
Instruments: UHSAS still out of service despite feverish efforts to clean its optical cavity windows between flights. Cold CN serial cable was disconnected at takeoff, but we were able to quickly reconnect it after we were released from our seats. Cobalt and DLH continue to perform well.
Observations: No evidence of a SAL on takeoff. Aerosol scattering and total number densities were relatively modest in the boundary layer over Sal, perhaps as a consequence of the cloudiness and light rainfall that took place in the region the previous day. Clouds were encountered soon after takeoff as we climbed to altitude. We observed many cases of cloud outflow at cruise, with attending enhancements in ultrafine aerosol number densities. A relatively thick dust layer was evident in LASE profiles near the center of the MCS. It was apparently being entrained into the heart of the circulation from the northwest quadrant. We penetrated the top of the layer during our 10 kft run and measured scattering coefficients ranging up to 50 Mm-1. We were unable to descend further down into the layer because of time constraints. On the descent into Sal, we sampled a thin pollution layer near 5 kft that exhibited enhanced submicron scattering, CO > 120 ppbv, and O3 of around 45 ppbv. We could not tell if this pollution was from a local or distant source, although it appeared to be somewhat horizontally extensive.
Flight 11, Mesoscale convection/Easterly Wave, Sept 3, 2006
September 4th, 2006
Team: Anderson, Chen, Podolske
Instruments: All working well except UHSAS. Over time, the instrument started showing noise counts in its lower size channels, which indicates that the sample cavity optics are dirty. In the process of cleaning the optics, apparently the light diffuser plate that covers the reference detector came unglued and blocked the beam from striking the detector. Unaware of this problem, we cleaned the optics a number of times but couldn’t get the laser voltage to rise above baseline. Just before being kicked off the plane at the end of our “no-fly” day, we spotted the displaced diffuser plate and glued it back into position. When we were allowed to re-board the plane this morning, we realigned the reference detector, but were unable to get the laser reference signal to more than 40% of nominal before having to button it up in preparation for flight.
Observations: For the first time since arriving at Sal on August 15, we did not see a Saharan dust layer over the field during takeoff–apparently circulation related to the ITCZ had deflected flow from the region to the north of Cape Verde. Convective activity was located very near Sal and we performed a number of deep cloud penetrations in the area around Praia and the Toga radar. Cloud outflow was sampled on numerous occasions during the high altitude flight legs. On the 10 kft leg coming back to Sal, we sampled what appeared to be a biomass burning plume. Evident as a dark haze layer on the horizon, the plume exhibited enhanced submicron particle concentrations and scattering, high aerosol absorption (SSA~.8), CO mixing ratios of ~110 ppb, and O3 mixing ratios of ~45 ppbv.
Flight 10, Easterly Wave/Dust, Sept 1, 2006
September 4th, 2006
Team: Anderson, Chen, Podolske
Instruments: All worked exceedingly well. Had some problems with software—several times the acquisition system froze up and had to be restarted—but lost very little data. Before the flight, I made several changes to the RRNeph sample line to reduce large particle losses. For the first couple of hours after takeoff, we operated the “submicron” RRNeph and PSAP without the inlet impactor to compare their measurements with those provided by the TSI Neph and “Total” PSAP. The two PSAPS gave almost identical readings across a broad range of aerosol extinctions. The RRNeph and TSI neph were within a few percent of each other at low altitudes when sampling a combination of sea salt and pollution, but the TSI Neph typically read 10 to 15% higher than the RRNeph within the dust layer. I suspect that the RRNeph may require a more substantial truncation correction than the TSI instrument.
Observations: We recorded vertical profiles of aerosol and trace gas parameters through the SAL after takeoff from Sal. The layer resided between 5 and 15 kft and exhibited scattering coefficients > 150 Mm-1. During the transit south to survey MCS within the northern portion of the ITCZ, we encountered several fresh cloud outflow cases with UCN > 12,000 and fine CN. On the north-south leg over Africa, LASE began to see heavy dust loading near 14 N in a layer residing between 2 and 5 km. The layer’s optical thickness increased as we proceeded northward toward the18 N waypoint. At around 17 N and 19 W, in route back to Sal, we briefly dipped to 15 kft and performed a quick constant altitude sampling leg. Although LASE profiles indicted that the layer was thinning at this point, scattering coefficients at 15 kft still exceeded 100 Mm-1. The dust layer was still evident at over Sal, and a complete vertical profile from 23 kft to the surface was recorded on landing.
Flight 9, Science Mission, 30 Aug 2006
August 31st, 2006
Team: Anderson, Chen, and Podolske
Instruments: All instruments worked perfectly! During the previous day, we were able to connect the UHSAS to an external computer, eliminating the need for the finicky on-board computer. We thus were able to collect a crash-free set of measurements from this extremely sensitive/accurate instrument.
Observations: Saw dust between 4 and 10 kft during climb out from Sal; LASE indicated the layer extended south to at least 14 N, where it was butting up against moist air associated with the ITCZ. On the 33 kft transit to 10 N, we observed lots of cloud outflow exhibiting high concentrations of ultrafine CN. Did not see much evidence of dust around the periphery of the MCS profiled on the southern end of the flight track, but observed significant coarse particle enhancement below (sea salt?) and above (dust) the cloud layer sampled around 13 N. After completing the microphysics modules, we climbed to 33 kft and flew north along the 24 W meridian to 20 N. LASE saw a significant dust layer build in between 2 and 4 km altitude, and north of 14 latitude. On the spiral descent at 20 N, we observed a relatively weak dust layer peaking at 13 kft and a very strong layer peaking between 5 and 10 kft. After completing a low stratus cloud microphysics module, during which we observed dust enhancements just above cloud tops near 4 kft, we climbed to 7.5 kft and sampled the dust layer southward along our incoming flight route. We were able to collect filter sample within the layer for about 45 min enroute to Sal. Scattering values along the leg were the highest we’d seen, peaking at >240 Mm-1. The dust microphysical/optical properties were similar to those we’d observed during previous flights, with the mass-weighted size distribution peaking at 2 um and > 80% of the scattering arising from coarse-mode particles. RH values ranged from 30 to 40% within the layer, however, which were much lower than we’d seen during previous samplings.
Flight 8, Science Mission, 26 Aug 2006
August 31st, 2006
Instruments: All instruments functioned normally, although the UHSAS computer crashed about 30 minutes before landing and we were unable to get it rebooted.
Team: Anderson, Chen, and Podolske (Cobalt, DLH)
Observations: We climbed out of Sal through a dust layer which extended from 5.5 to 10 kft. Peak scattering values exceeded 100 Mm-1, but particle number densities were generally
Flight 7, Science Mission, 25 Aug 2006
August 31st, 2006
Team: Winstead, Anderson, Chen and Podolske (Cobalt, DLH)
Instruments: Had extreme difficulty in getting UHSAS on line. With DC-8 technician help (thanks, Donnie), we removed the instrument from the rack, reseated all its boards and connectors, and generally tried everything we could think of for 2 hours, trying to get a consistent pulse. We finally gave up, re-mounted it within the rack, switched the power on and off a few times, and it magically started collecting data about 1 minute before we rendezvoused with the British BAe146 for instrument comparison flight legs. Whew.
Observations: The early portion of this mission was dedicated to intercomparing in situ measurements on the NASA DC-8 and the British BAe146. The aircraft rendezvoused near 16 N and flew in formation to 20 N, sampling for 10 to 15 min each at 18, 7, and 8 kft. A rather dilute Saharan dust layer was present between 5 and 10 kft over the northern portion of the flight track. Scattering coefficients varied from 50 to 75 Mm-1 on intercomparison legs at 7 and 8 kft near 19 deg N latitude. CN concentrations in the dust layers were fairly low, around 300 cm-3, while CO mixing ratios were ~85 ppbv and RH was ~50 to 60%. After breaking off from the BAe146, we climbed to high altitudes, where we sampled several cloud outflow layers which contained low concentrations of hot CN, somewhat elevated CO (>90 ppbv), but ultrafine CN number densities approaching 10,000 cm-3. The dust layer was again penetrated during approach into Cape Verde for landing; scattering coefficients were comparable to those measured on the intercomparison flight leg.
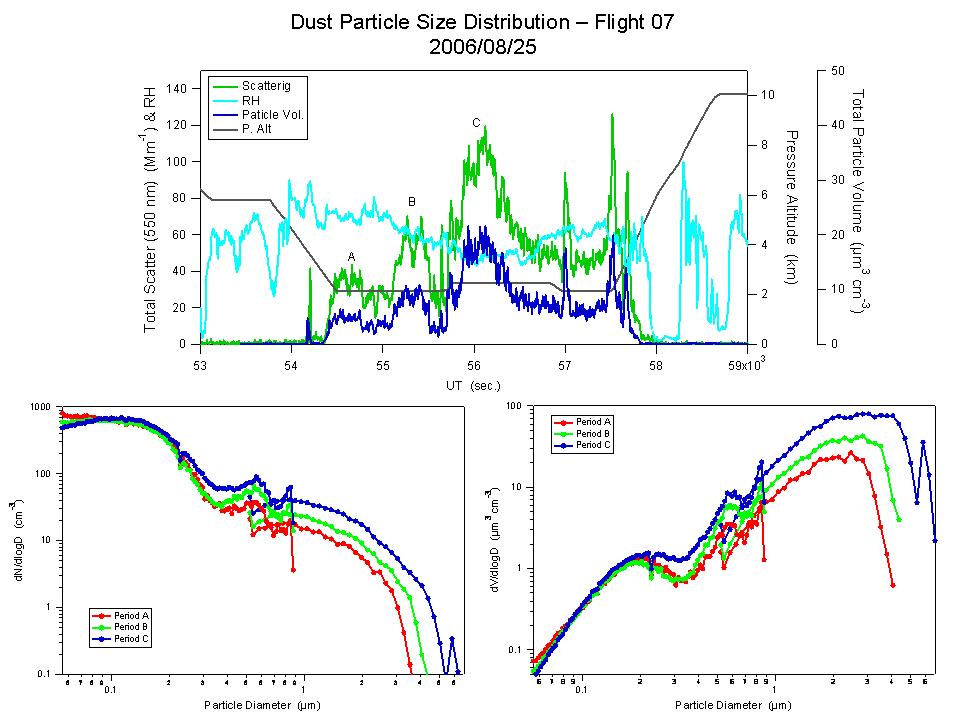
Time series and size distributions from intercomparison flight legs.
Flight 6, Science Mission, 23 Aug 2006
August 31st, 2006
Instruments: Hot CN back on line; all other instruments worked normally.
Team: Winstead, Anderson, Diskin (DLH), and Podolske (Cobalt)
Observations: Most of the mission was conducted at high altitudes, dropping sondes and recording remote measurements in the vicinity of “Debbie”, which was positioned west of Sal. Cloud outflow was frequently sampled around the periphery of the MCS. These parcels exhibited low aerosol surface areas and huge enhancements in ultafine (10,000 ultrafine and 10 nm) particles cm-3. During vertical soundings conducted as part of the cloud microphysics module, enhanced large particle (dust?) concentrations were seen at lower altitudes in clear air outside the cloud. Dust layers were sampled during climb out and descent into Sal; these exhibited aerosol optical and microphysical properties that were similar to those recorded during flight 5.
Flight 5, Science Mission, 20 Aug 2006
August 31st, 2006
Instruments: Gave up on the RRneph used for total scattering, couldn’t get it going after much effort. Hot CN still not working properly; we suspect a bad connection inside the instrument.
Team: Winstead, Anderson, Diskin (DLH) and Podolske (Cobalt)
Observations: This mission primarily focused on remote sensing of the SAL and convective cloud sampling near the ITCZ. However, a vertical sounding was recorded near 13 N, which showed enhanced dust concentrations between 5,000 and 17,000 feet altitude. Scattering coefficients exceeded 150 Mm-1 at 9,500 ft. Mean mass diameters were ~2 um throughout the layer and coarse particles were responsible for about 80% of the total scattering. Relative humidity was positively correlated with dry aerosol scattering coefficients and peaked near 80% at 9,500 ft. Lidar (LASE) backscattering profiles indicated that the layer extended from the convective cloud region to at least as far north as Sal. This was supported by our in situ measuremens, as dust layers were penetrated on both the climb out and descent into Sal.
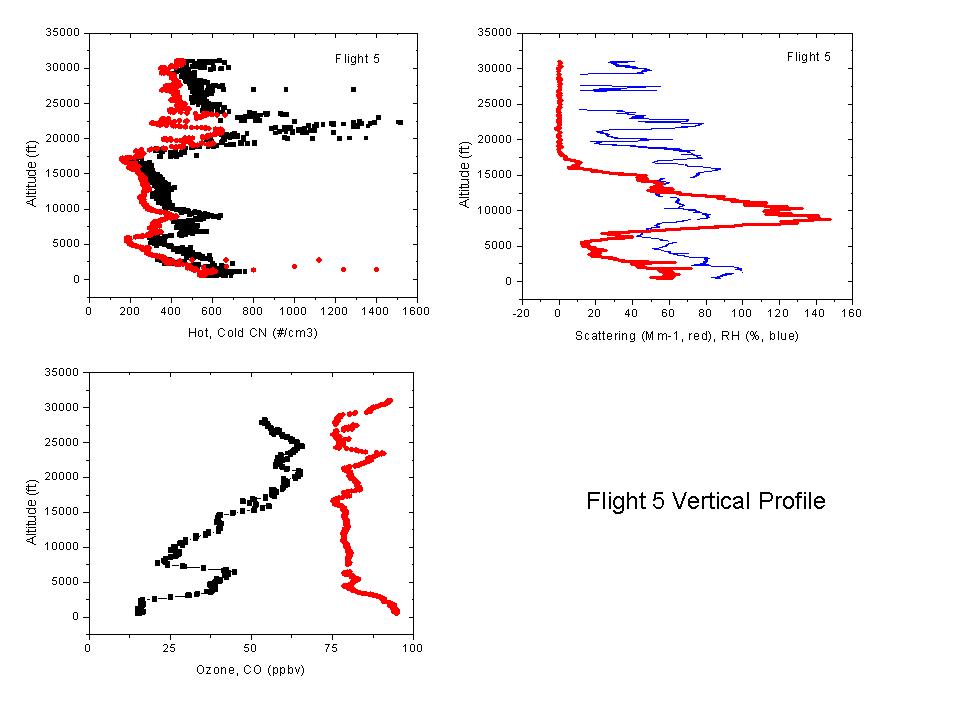
Vertical profile recorded near 13 N during flight 5. Note layered structure of the atmosphere and the high RH values in the SAL at 9.5 kft.
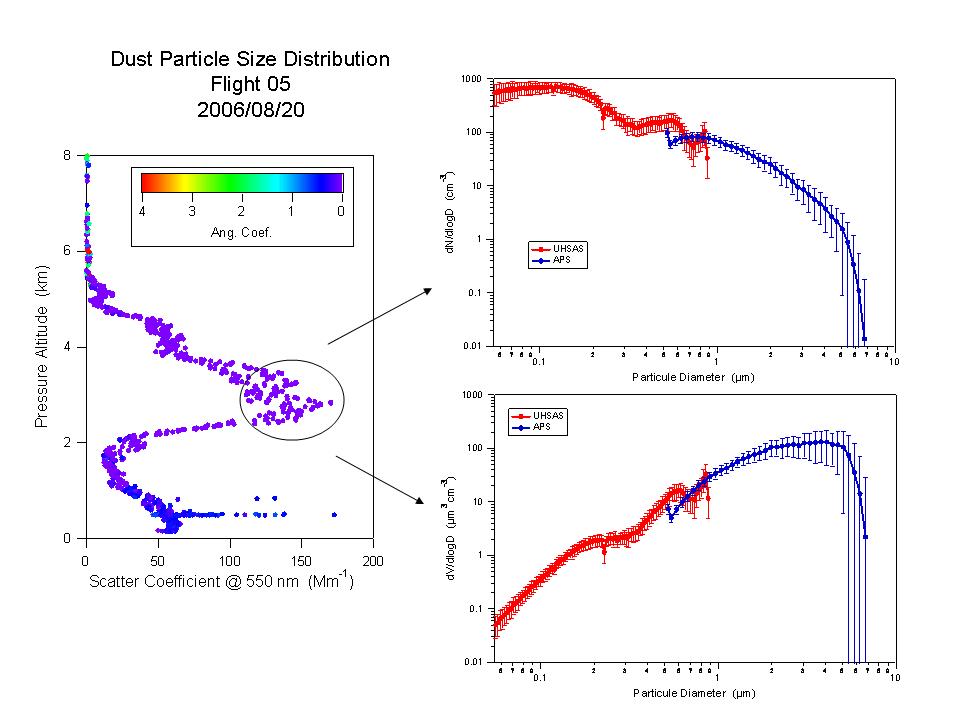
Angstrom coefficients and number/volume size distributions recorded during the vertical profile.
Flight Team: Winstead, Anderson, Diskin (DLH), and Podolske (Cobalt)
Instrument Performance: All systems worked nominally except hot CN counter, which was out of commission for about 25% of the flight due to butanol floods, and the Radiance Research total scattering nephelometer, which was completely inoperable because of an electronic problem.
Interesting Observations: Vertical profiles were performed through the marine boudary layer and Saharan Air Layer (SAL) on takeoff over Cape Verde, near Praia, and near 14 degrees North about 30 minutes before landing. Excellent particle size distribution, number densitiy, and optical parameter (wavelength dependent scattering and absorption) measurements were recorded in each case. Scattering coefficients were very high over Cape Verde (>150 Mm-1 at green wavelengths) at takeoff due to a combination of sea salt and dust aerosols. Although coarse particle loading was enhanced at all levels below 4.5 km over the northern end of the flight track, the most dense layers, which exhibited scattering coefficients exceeding 200 Mm-1, were observed near 1.5 km and 3 km during the final downsounding. Mass-based particle size distributions measured with our cabin-mounted instruments peaked at about 2 um in these layers, however data from wing-tip mounted, open cavity probes indicate that particles > 10 um were present.
On the highest flight legs, outflow from convective clouds containing high water vapor concentrations, low aerosol surface area, and huge numbers (10,000/cm3) of nano-particles were observed. Nucleation was apparently still in progress as very few (