LASE

NAMMA Banner

LASE Science Flight 13 (Sept 12) Sampling TD#8

October 30th, 2006

LASE had a good flight today. We were profiling a new convective system Tropical Depression #8) that has circulation, convection, and lightening associated with it.  It is better organized and moving faster than earlier systems that were sampled by the DC-8 during this mission. The flight plan looks like a figure of 8 with the center of flight patter located near 12.5 N and 21.5 E close to the center of the convective system.  The SAL layer was present on the northern and northwestern part of the track and it fizzled out as we proceed towards convective and moist region.  A less intense SAL was present in the southern (8 N latitude) and southwest regions on the periphery of the storm.  Because of lack of many dropsondes on the plane we did a number of proposing maneuvers that allowed in situ sampling.  We were in and near clouds during a significant portion of the flight so our capability for full water vapor profiling was limited.  The TD was evolving as the flight progressed and appears to be developing into a significant storm.
 Slide11.PNG

 Slide22.PNG

Slide31.PNG


LASE Science Flight 12 (Sept 9) Profiling TD#7 Pre-Helene

October 30th, 2006

LASE had another good flight today. The flight was a figure 8 pattern to the south and southwest of SAL.  The lower loop circled a mesoscale convective system reaching down to latitude of bout 9 N. Another feature of today’s flight was proposing maneuvers over most to the legs designed to permit in situ sampling to preserve the dropsondes. LASE saw two dust layers the normal higher latitude dust layer in a low moisture environment that was centered at an altitude of 3.5 km another one at lower altitude.  We passed the dry layer quickly.  However, the other ‘aerosol or dust’ layer was associated with higher moisture levels than seen in the past.  This dust layer over a low altitude range of 0.5 to 2.0 km persisted all the way to about 10 N.  We continued to see this layer on part of the return leg, and in situ sampling indicated that the particle sizes were smaller than seen in the dry layer.  It was a good survey flight over south and eastern regions of SAL.  LASE again had good comparisons with in situ water vapor measurements throughout the flight.   Fewer dropsondes were launched during the flight and in many cases these were launched under cloudy conditions. The higher latitude dust layer close to SAL seems to have fizzled out. We did a number of proposing maneuvers and in situ dust samplers collected data during ascents and descents.  These data should complement LASE aerosol profiling to better characterize the dust layers.

Slide12.PNG

 Slide21.PNG

Slide3.PNG

Slide4.PNG


LASE Science Flight 11(Sept 8), Weak Wave Near Coast

September 11th, 2006

LASE had a very good flight today.  It was a good survey flight over south and eastern regions of SAL.  We were able to profile  dust layers that were generally associated with low moisture, and and, generally, dust free high moisture regions in the south all the way to ~10.50 N latitude and  southeast into Senegal (14.8 E Log, 15 N Lat.). We saw deep and anvil cirrus at southern latitudes.  The southern regions contained a lot of clouds but there were many windows that allowed an opportunity to profile to the ground.  LASE had good comparisons with in situ water vapor measurements throughout the flight.  A number of dropsondes were launched during the flight and this would provide a good opportunity for comparison with LASE. A dust layer was present over SAL over the altitude region 0.5 to 4.5 km. In situ dust sampling during ascents and descents should complement LASE aerosol profiling to better characterize the dust layers.
  test

 Slide13.PNG

Slide23.PNG

Slide32.PNG


LASE Science Flight 10 (Sept. 5) Dust/SAL sampling and profiling

September 6th, 2006

This was a tremendously successful LASE flight for observations of SAL on 9/5/06. This entire flight was devoted to investigating SAL characteristics with LASE and in situ measurements. An intense layer of dust was observed near the coast of Africa and inland. The altitude of the dust layer altitude from near surface (0. 5 km) to above 5 km. As the aircraft crossed from the ocean to land an intense highly structured boundary layer was observed on land which merged with the dust layer above. LASE observations provided guidance for flight planning and in situ sampling .Dust layer scattering varied in intensity with altituder and narrow layers with intense scattering were observed. LASE guided in situ sampling of the layer and at one location the dust layer was embedded in a region of cloud with RH ~ 100% at an altitude of 14 kft.

Slide14.PNG

Slide15.PNG

Slide41.PNG

Slide15.PNG

LASE Science Flight 9 (Sept. 4) Easterly Wave

September 5th, 2006

LASE had an excellent second wave flight with dust, cloud, and moist distributions around and across the wave. Dust was found between 1-3.5 km on the north and south side of the center of wave as we cross it at 14:22:30 UT (we were obscured by clouds right over the center of the low level circulation). When we descended down to 10 kft for the second crossing of the center, we found the dust was present below the clouds we had flown over on the first pass of the center. At about 1650 UT, we observed a large, cloud-free pocket of dust below 3 km, and the in situ measurements being made at 10 kft showed some large particles (greater than 3 microns) in the top of the layer (most of it was below the plane and there wasn’t time to go down to sample it). We also pick up the leading edge of some dust south west of Sal on our return high altitude leg. We got excellent moisture data when we were not obscured by clouds, and while there was dust present at low altitudes along the track, those layers were not very dry compared to nearby dust-free regions. Details on the flight track, aerosol distributions, and water vapor cross sections are attached. Slide11.jpg Slide22.jpg Slide32.jpg

LASE Science Flight 8 (Sept. 3) Easterly Wave

September 4th, 2006

LASE had a very good flight around the easterly wave that we were sampling on the first of a three day consecutive sampling sequence. We went into the clouds immediately after takeoff to work with the Praia radar which precluded any LASE data. We were in mostly clouds until we got on the western most point of the larger pattern were we could see to the surface and found a low level dust layer below about 2.5 km. We ran out of it by about 17.5N and found the cleanest conditions of the mission on the eastern most leg of the pattern. It was very moist throughout the entire region below about 4 km. We only picked up an indication of dust on the 10 kft run back to Sal near 16N/23.5W. This was a successful flight with reasonable measurements around the north and eastern flanks of this wave. We are planning a second flight to sample this wave tomorrow.

Slide1.jpg

Slide21.jpg

Slide31.jpg

LASE Science Flight 7 (Sept. 1) Easterly Wave

September 4th, 2006

LASE had an excellent flight observing dust and water vapor distributions north and west of the convection which started at about 13N.  A heavy dust layer was observed on ascent out of Sal between 2-5 km with the peak loading centered near 3 km.  Not much dust was noted near the surface before takeoff at 1300 UT.  The moisture below the dust layer was high, but the dust layer was reasonably dry.  It was extremely dry greater than 1 g/kg above ~7 km.  Just as with Flt 9, the dust layer ended at ~13.5N which was just before we went into the first convection.  We were in the clouds on the trip down to 9N, but on the NE leg we just cleared the clouds near 13N for a short time (~10 min) before re-entering the clouds on the SE leg to 9N.  After turning NE toward the coast of Guinea, we cleared the clouds and observed the dust layer between 3-4.5 km.  We passed through Senegal and were headed back direct to Sal when we were alerted to a strong dust outbreak near the coast of Mauritania.  We went north along 13.5W to 18N and encountered the strongest dust layer of the campaign! 

The top of the layer was up to 5.8 km, and the maximum scattering from the layer was about 3 times greater than seen previously.  There was large extinction of our measurements towards the surface, and the surface could not be seen at all visually.  We attempted to descend down into it for an in situ sampling, but by the time we got permission we were beyond the heaviest aerosol loading.  The in situ measurements we did get showed high loading, but it couldn’t have been as large as in the strongest portion of the layer.  We made good water vapor measurements through the dust layer and found it to be dry with values less than ~6 g/kg compared to moist layers near the surface of less than 15 g/kg.  Good LASE water vapor comparisons with dropsondes were found throughout this flight.

LASE Flt10 Image 3LASE Flt10 Image 1LASE Flt10 Image 2

LASE Science Flight 6 (Aug. 30) Cloud Microphysics and Dust Sampling

August 31st, 2006

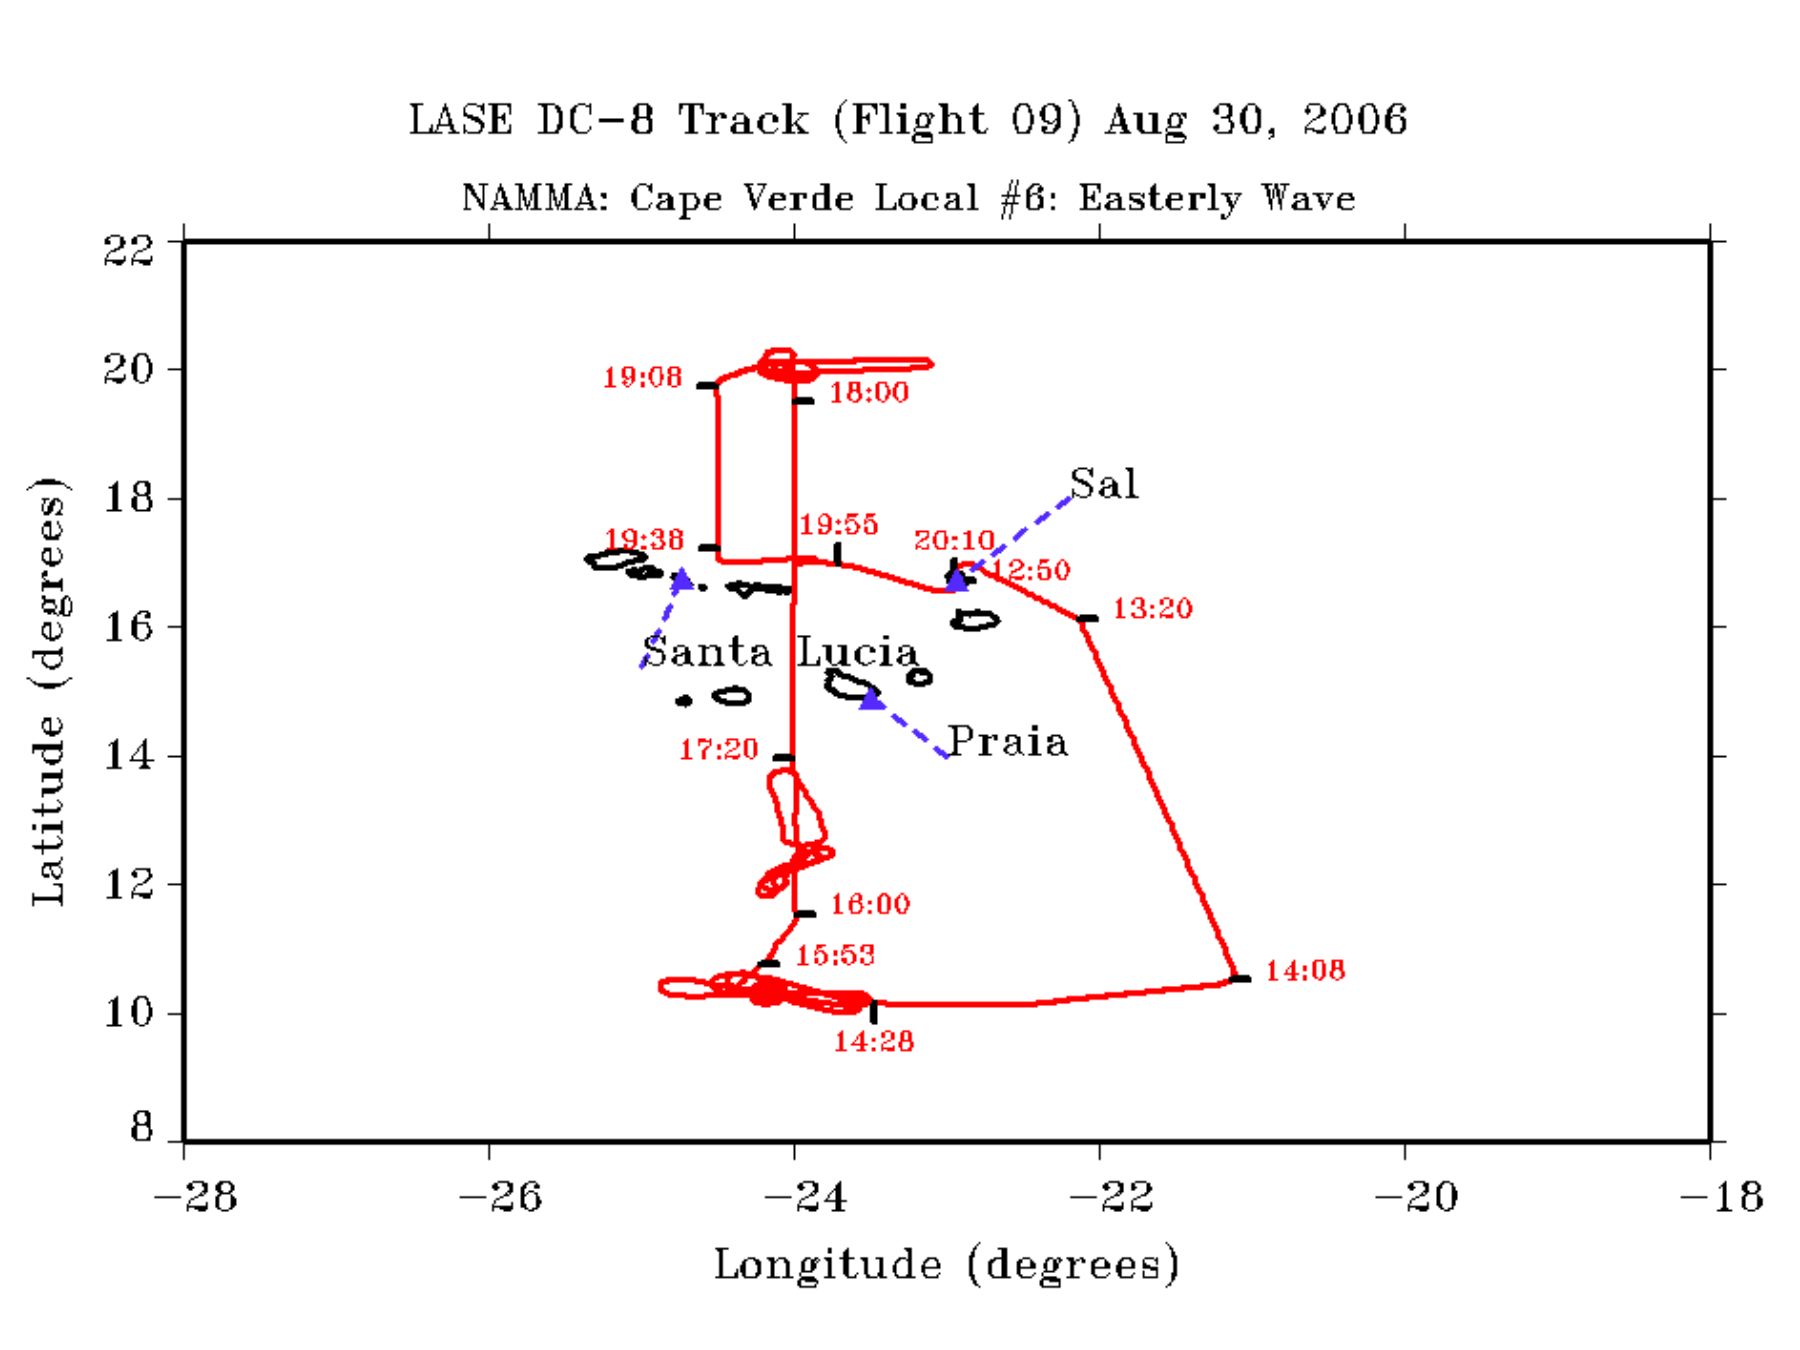
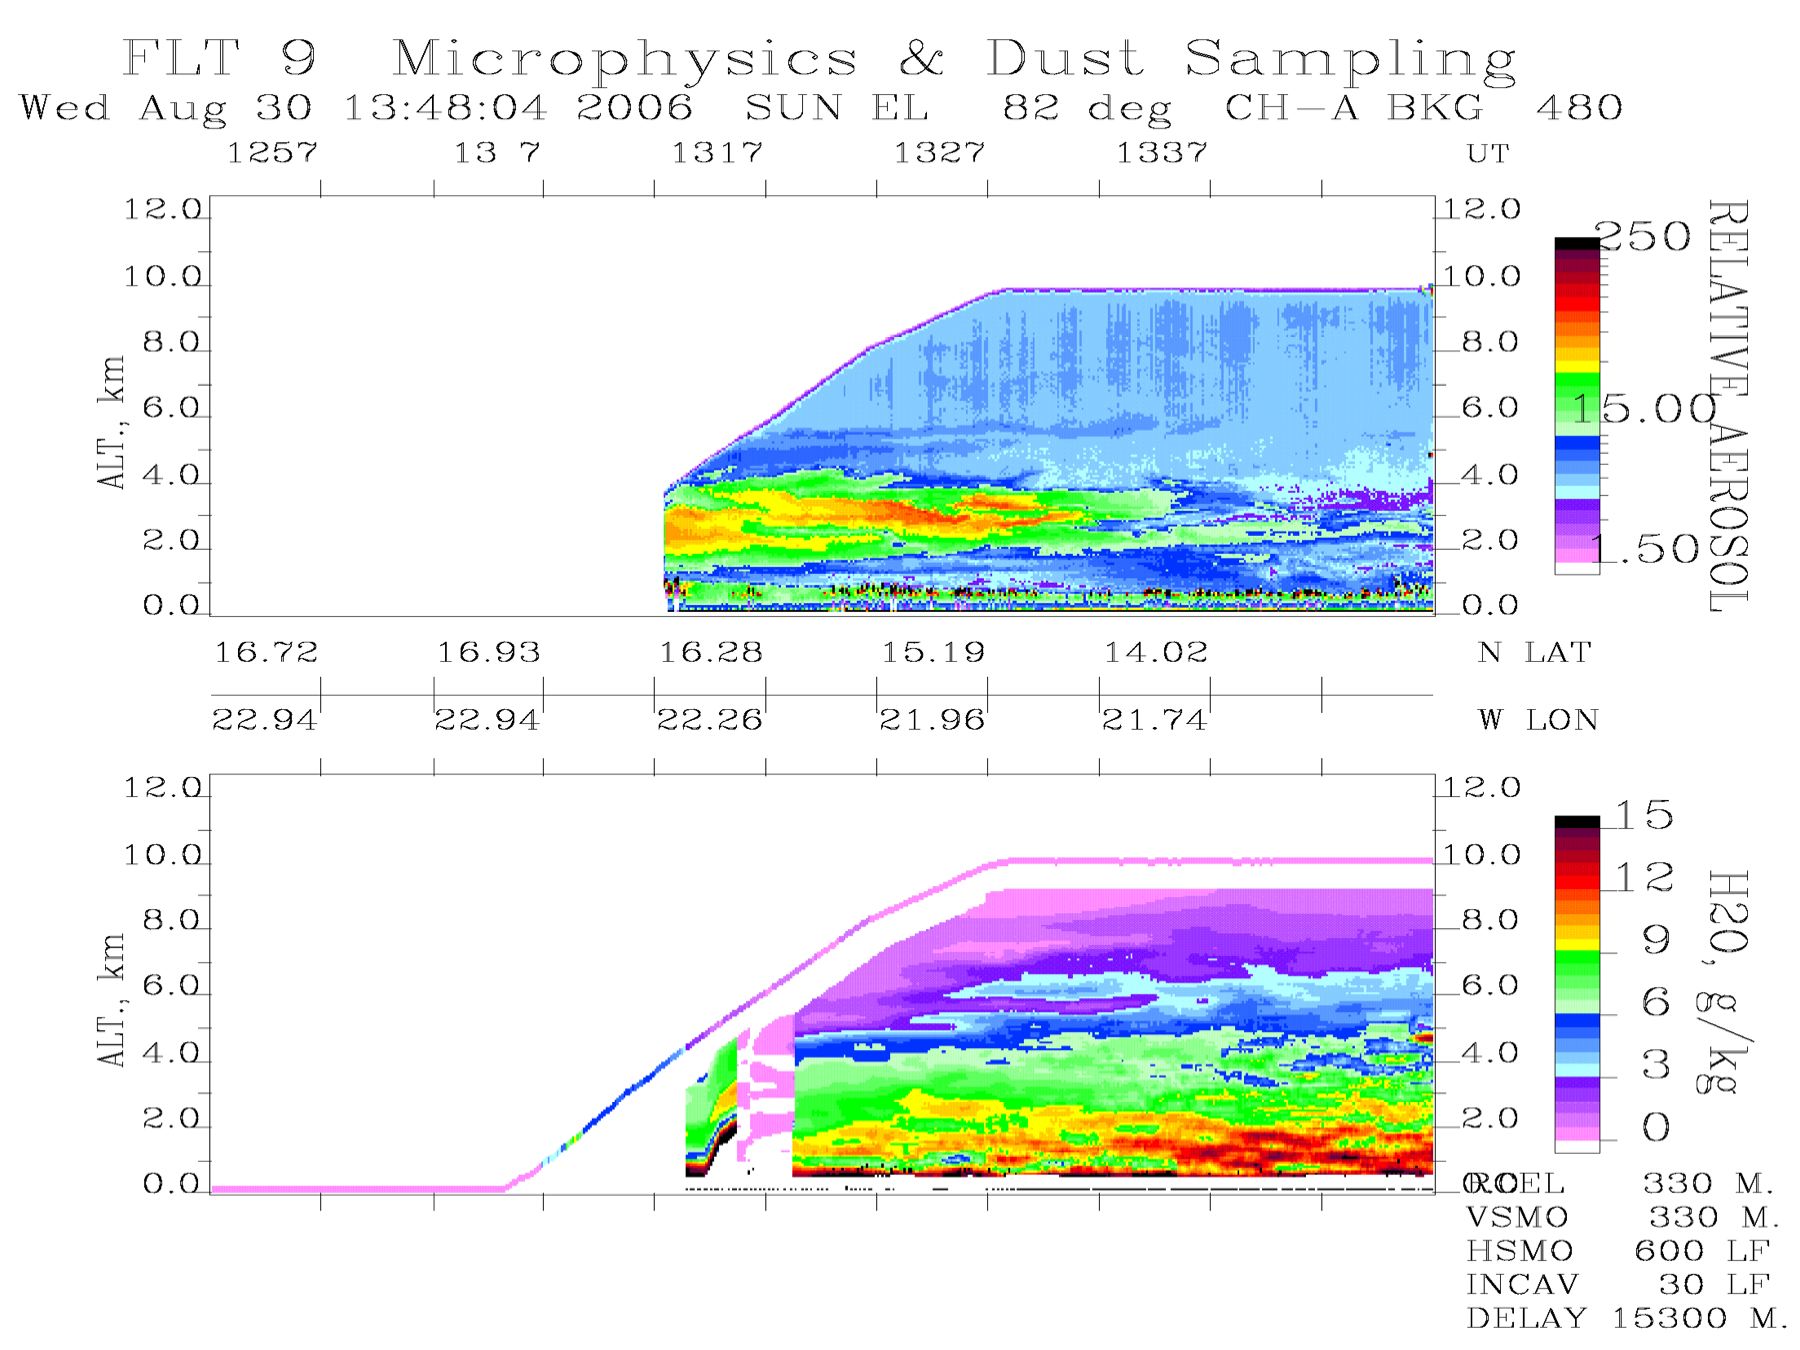
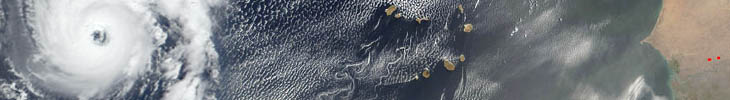
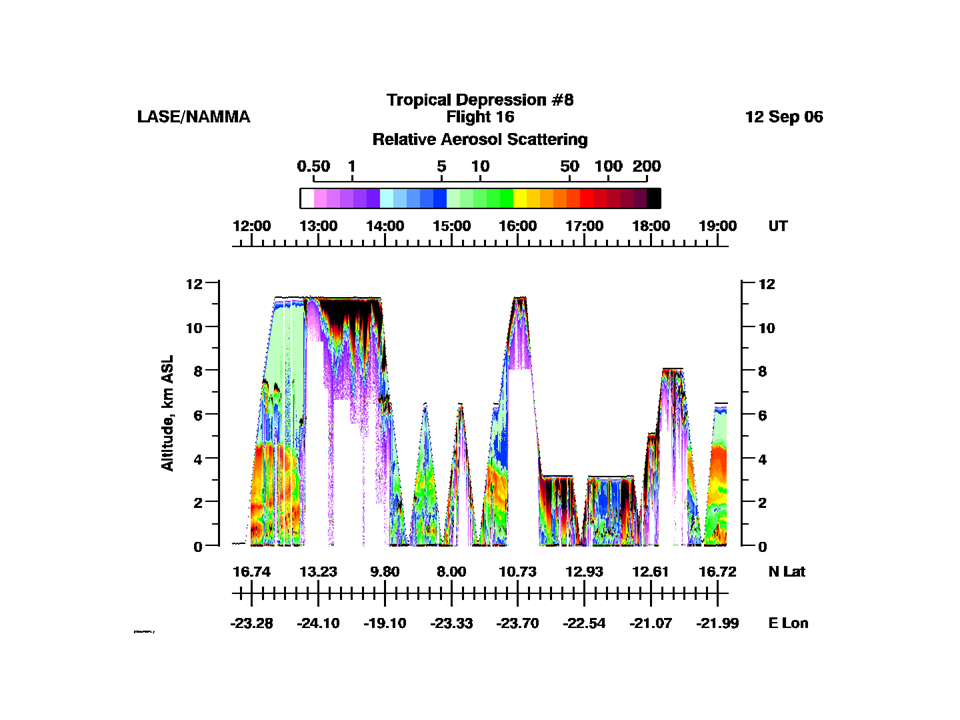
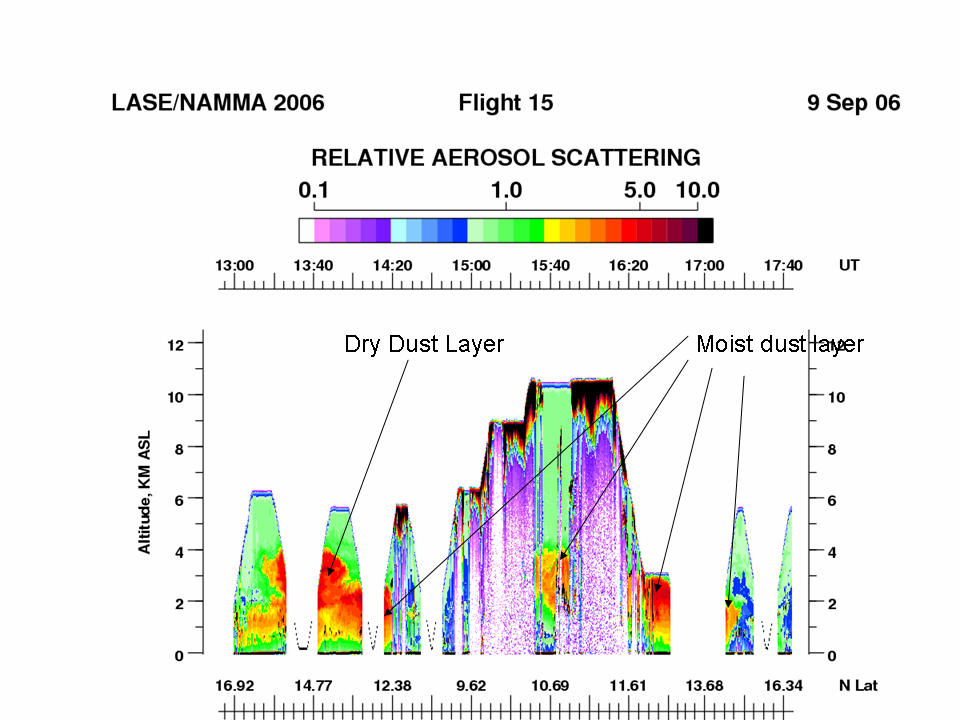
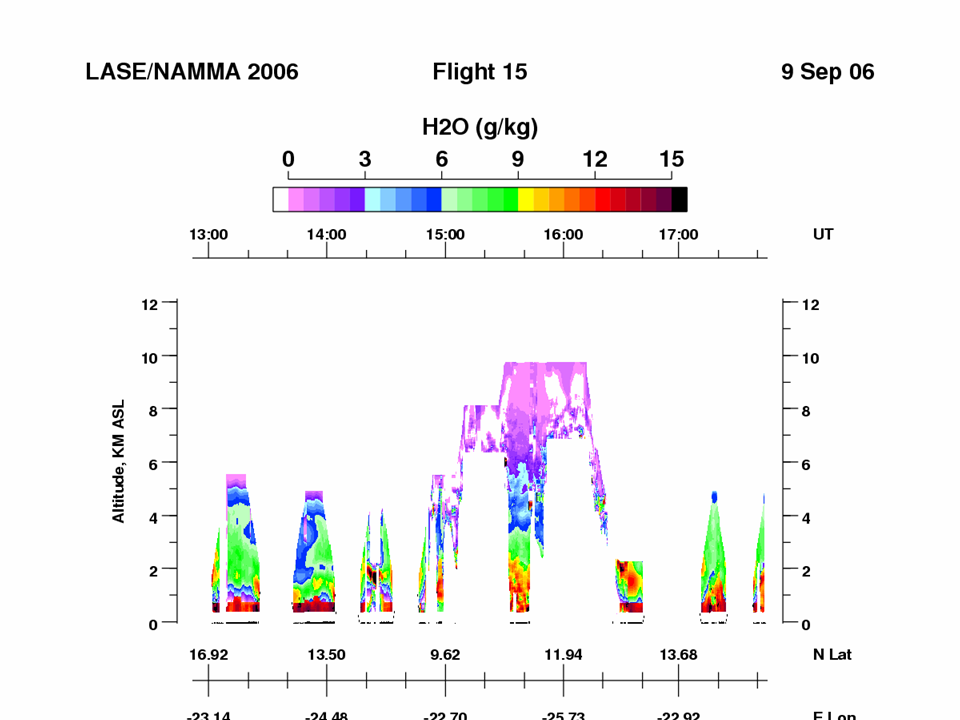
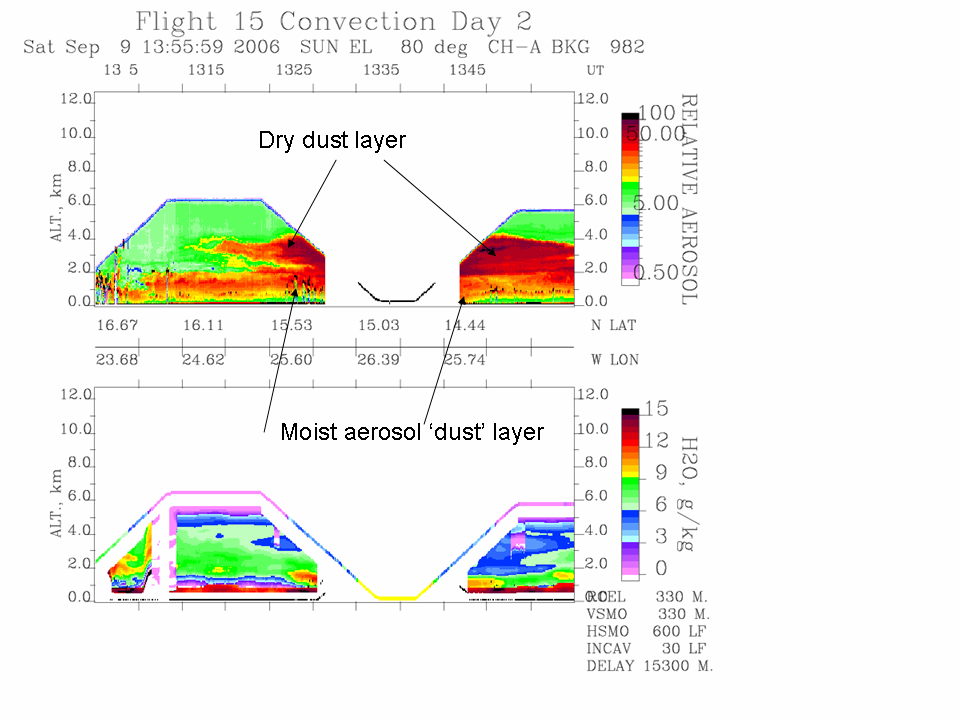
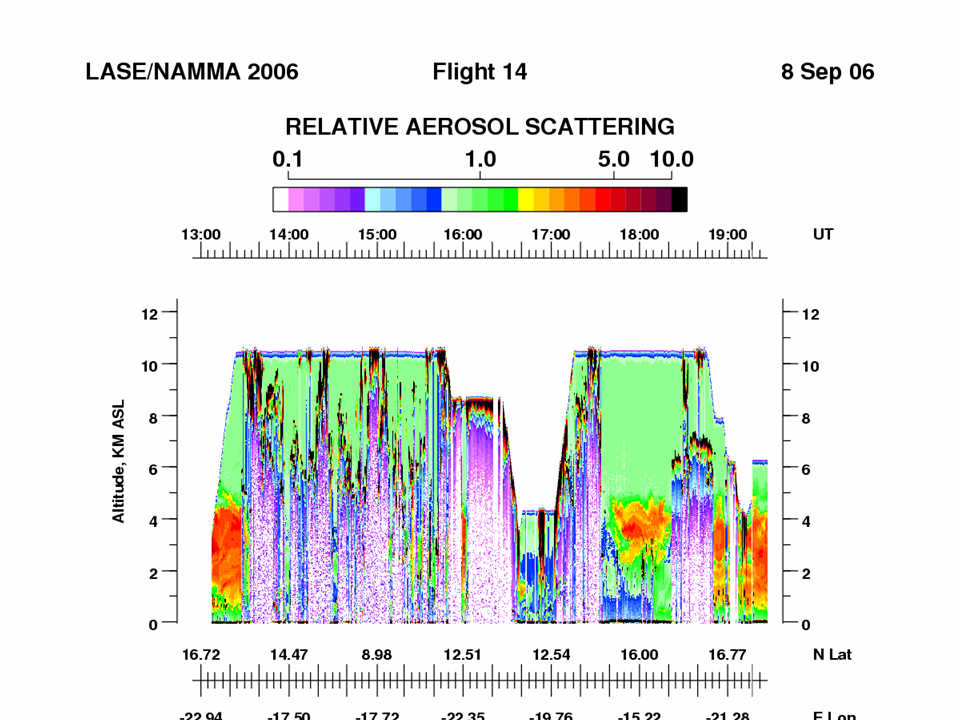
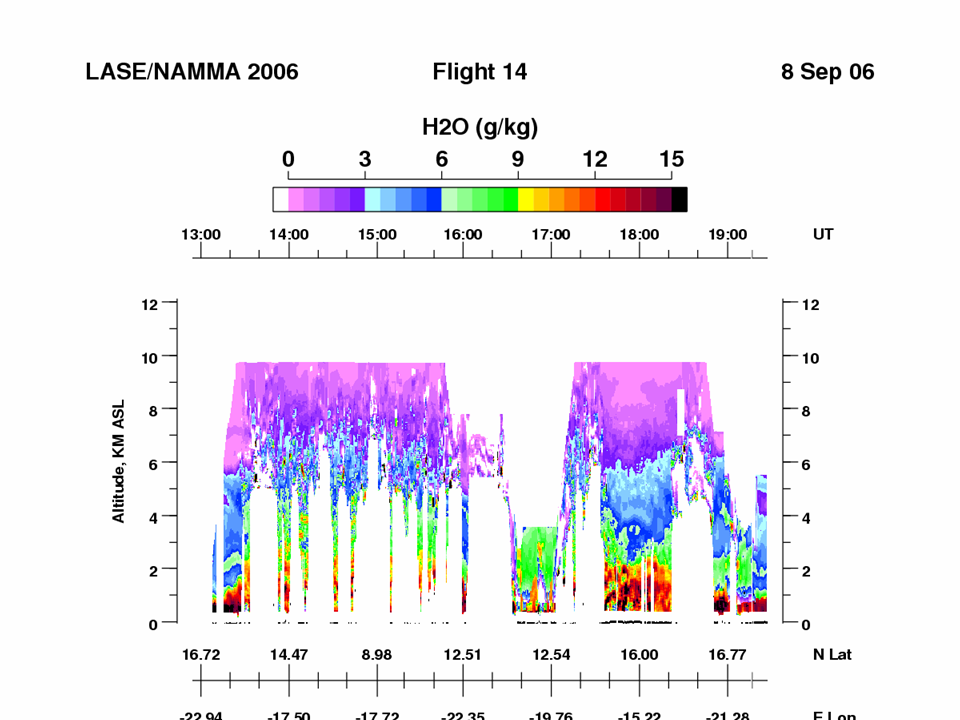
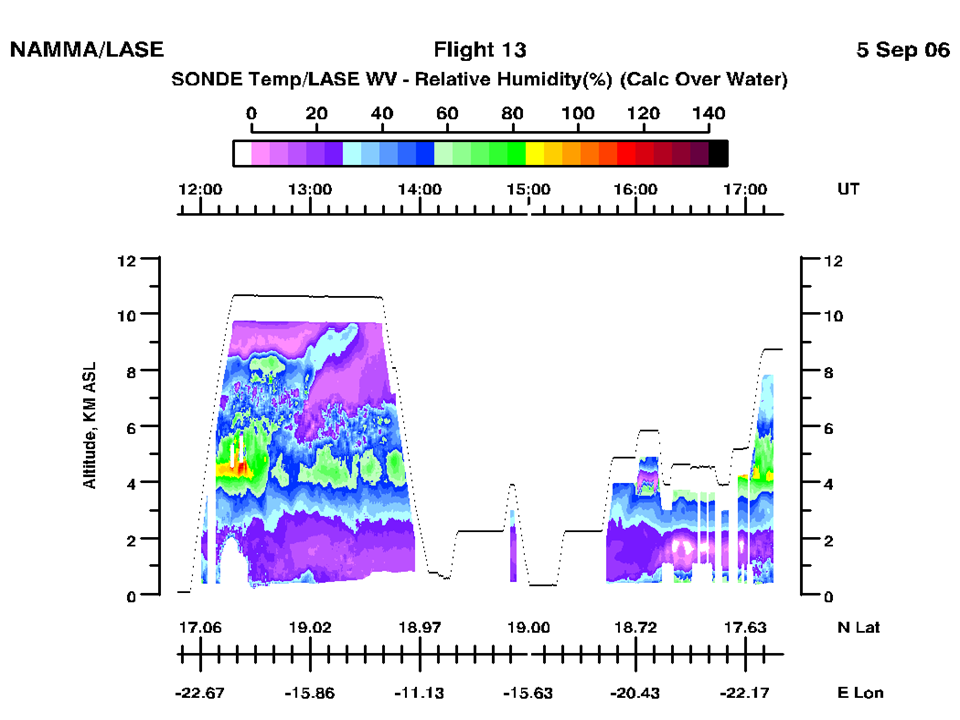
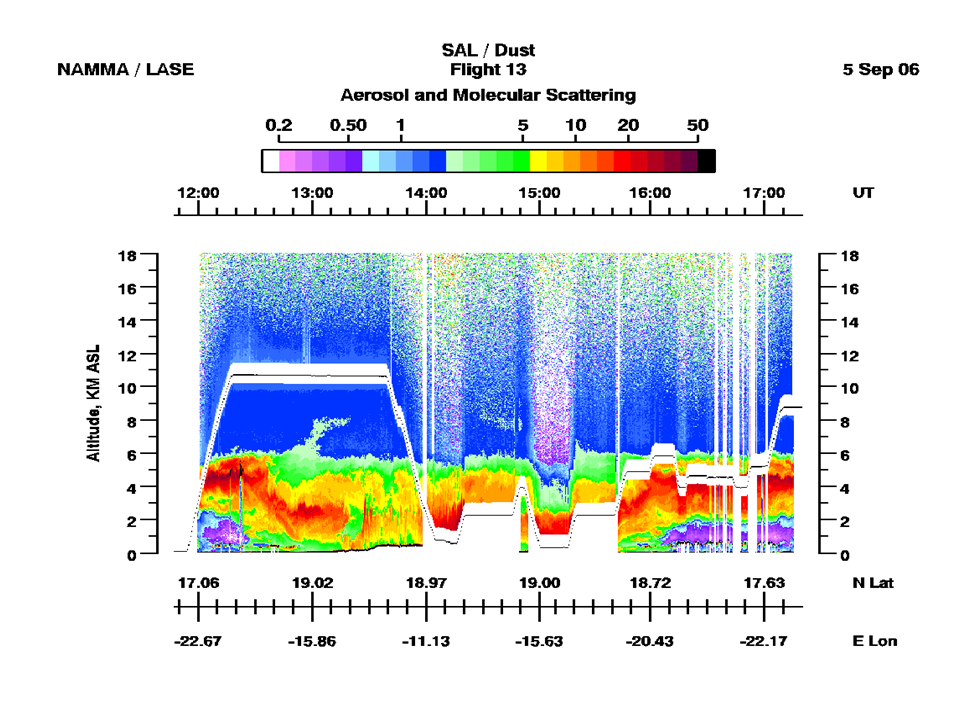
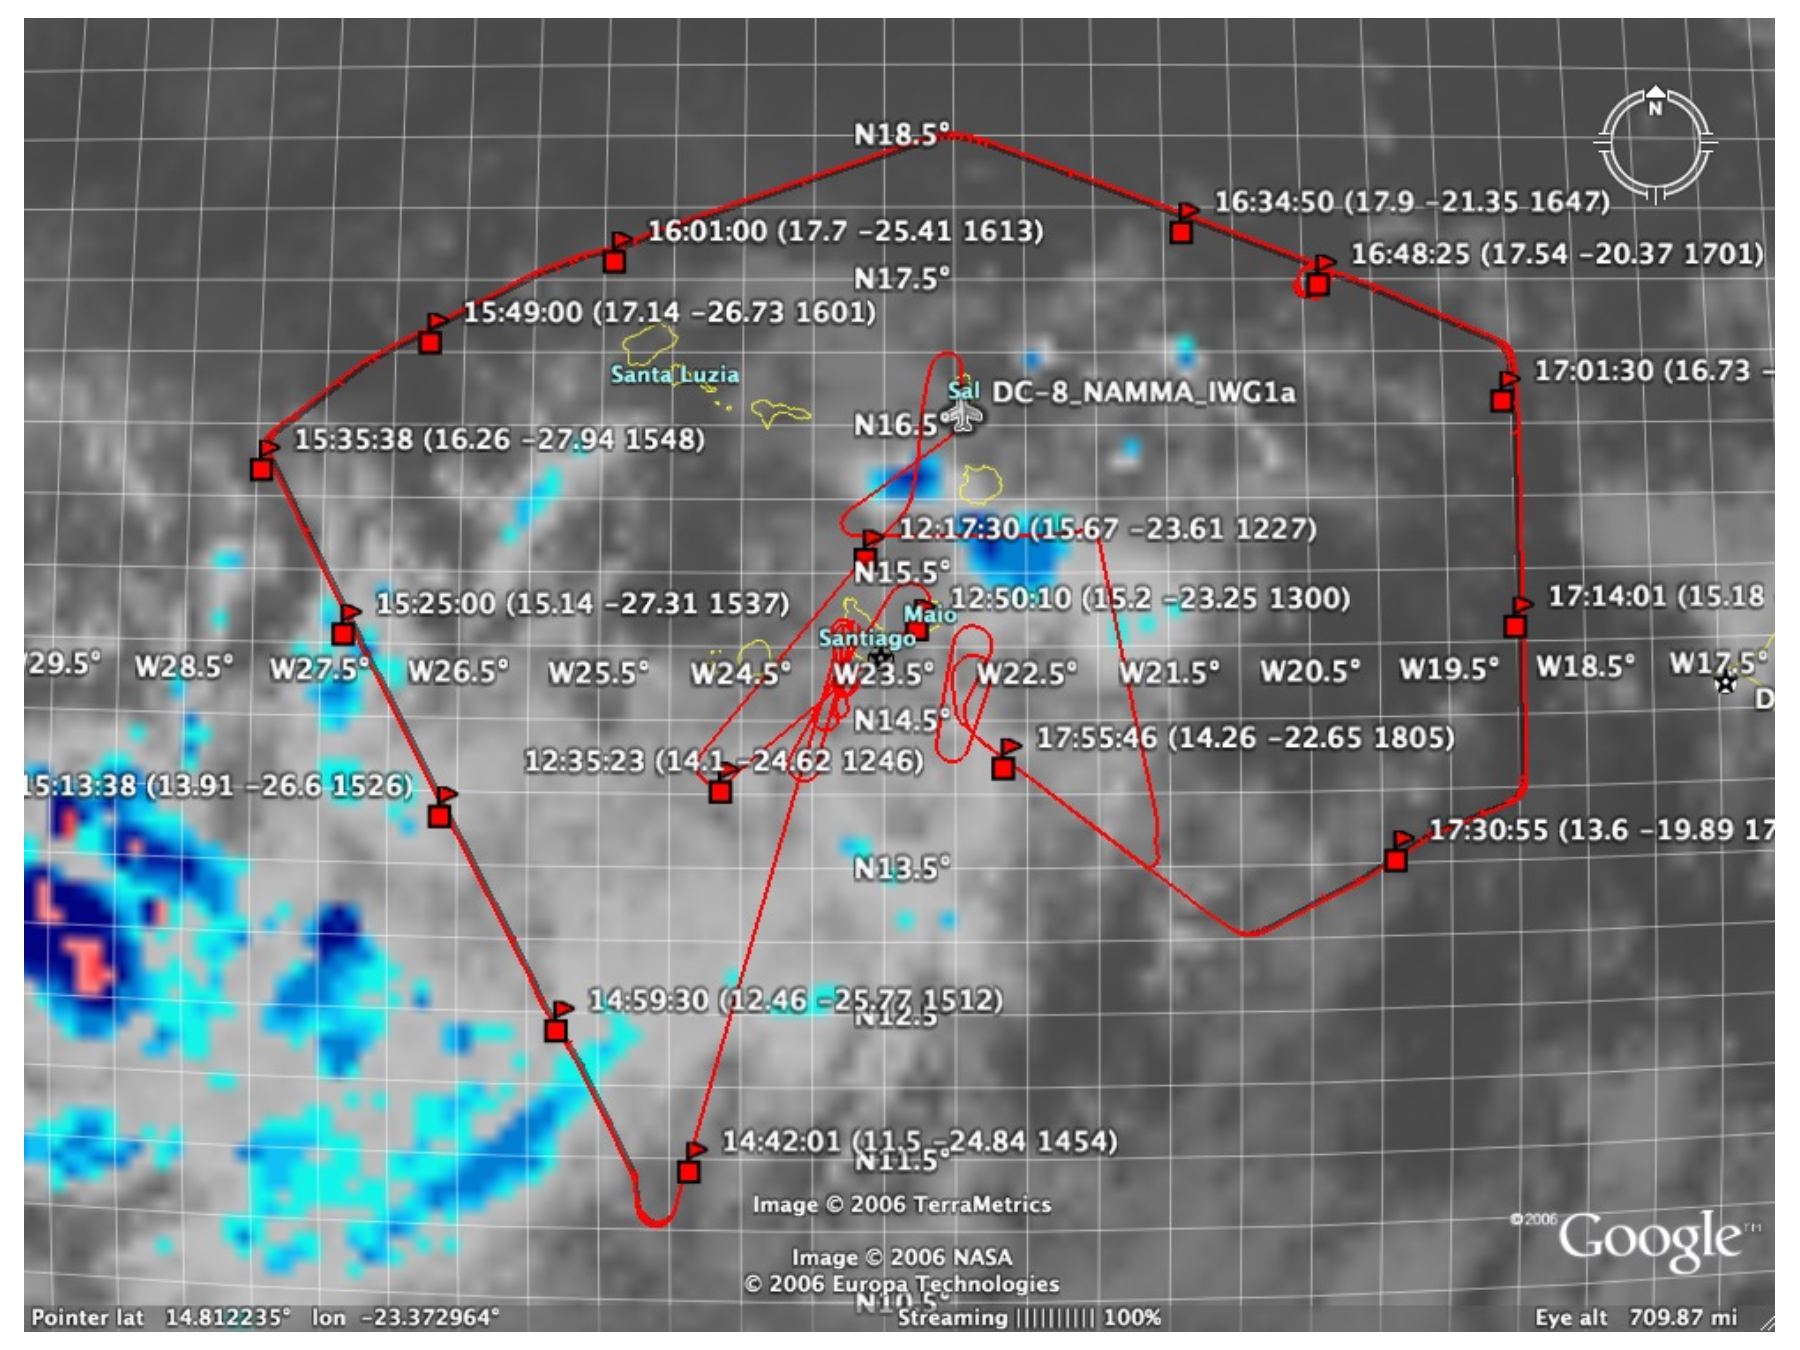
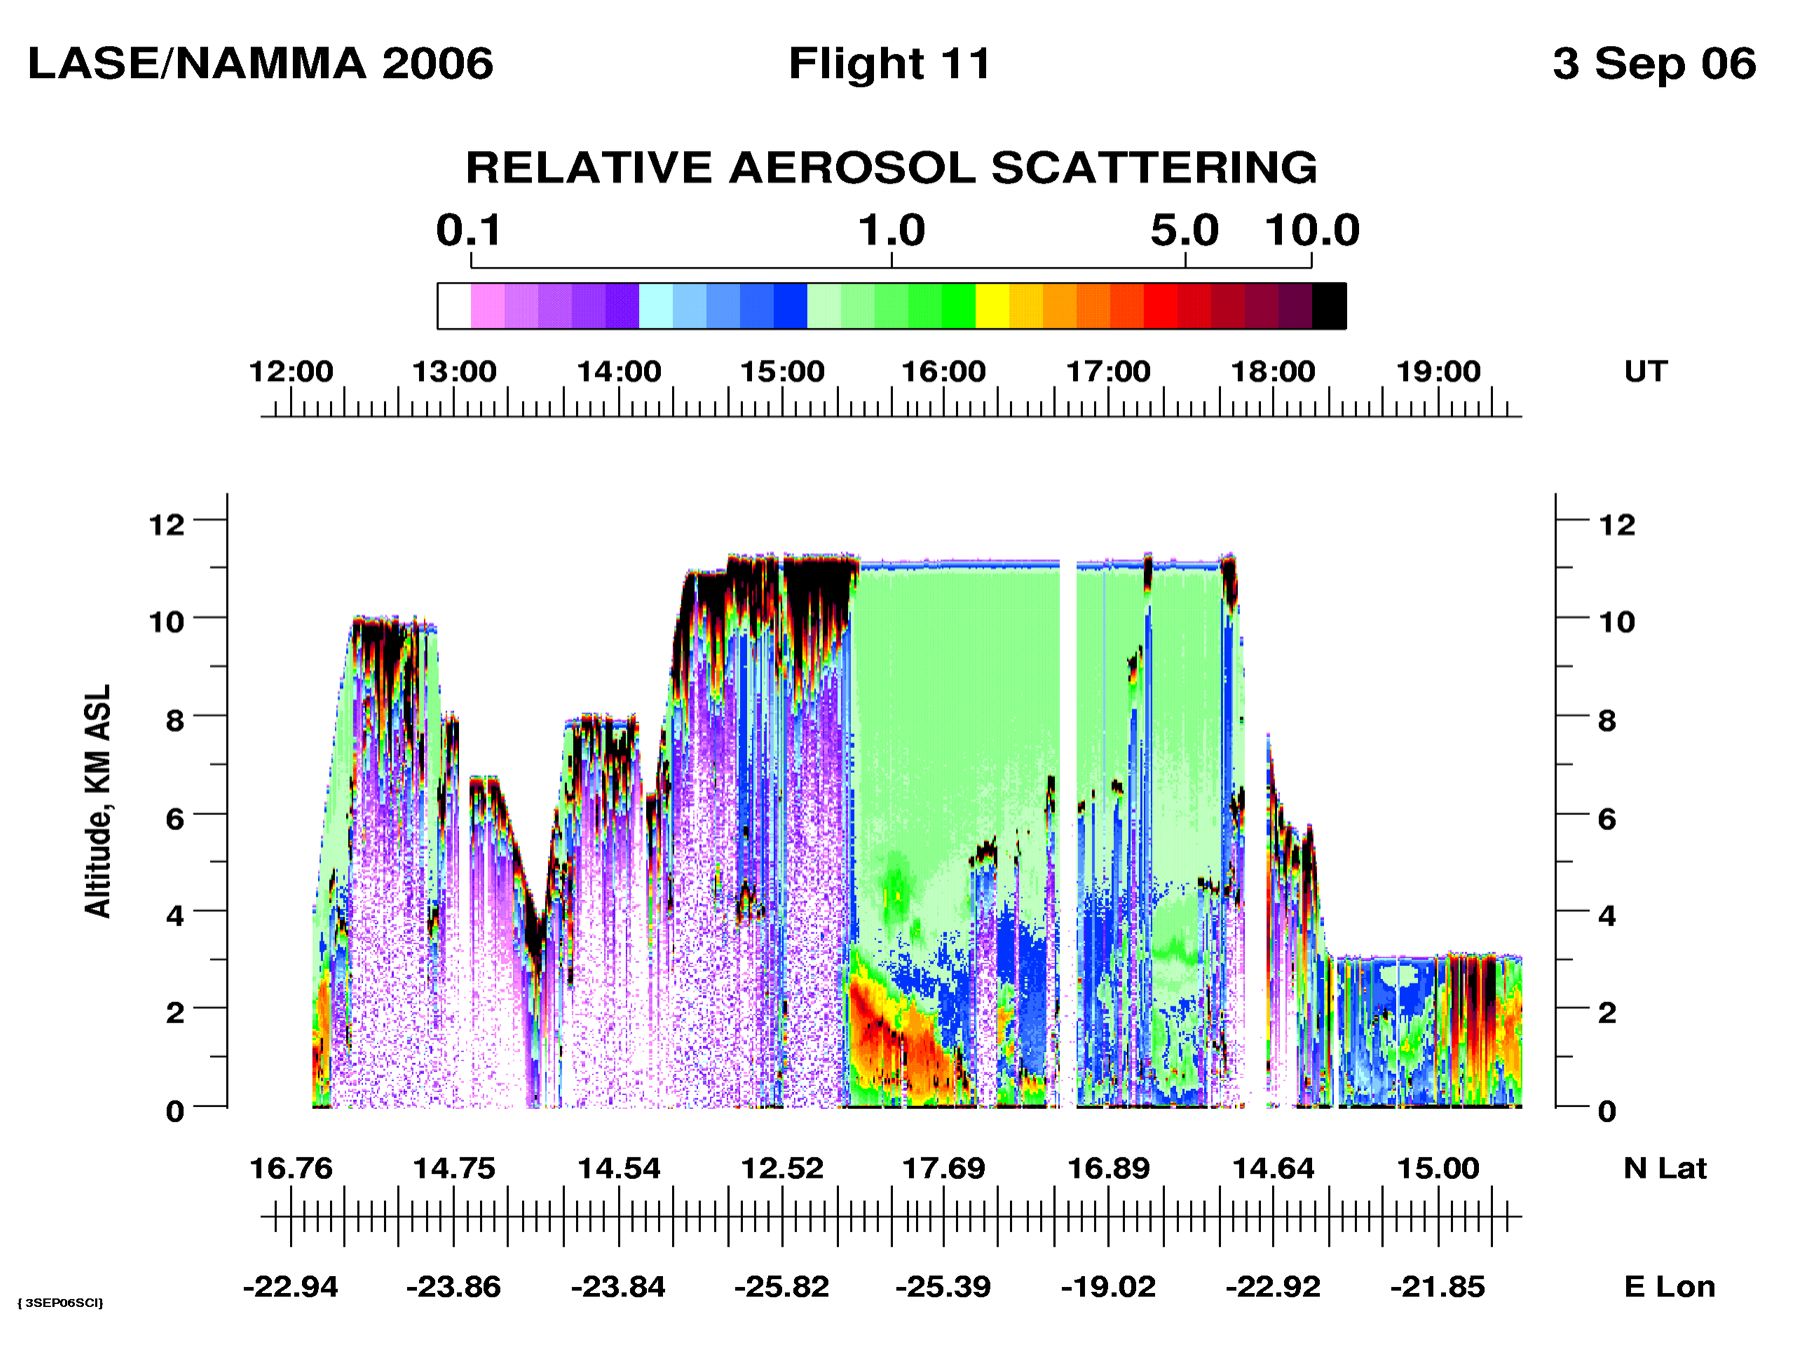
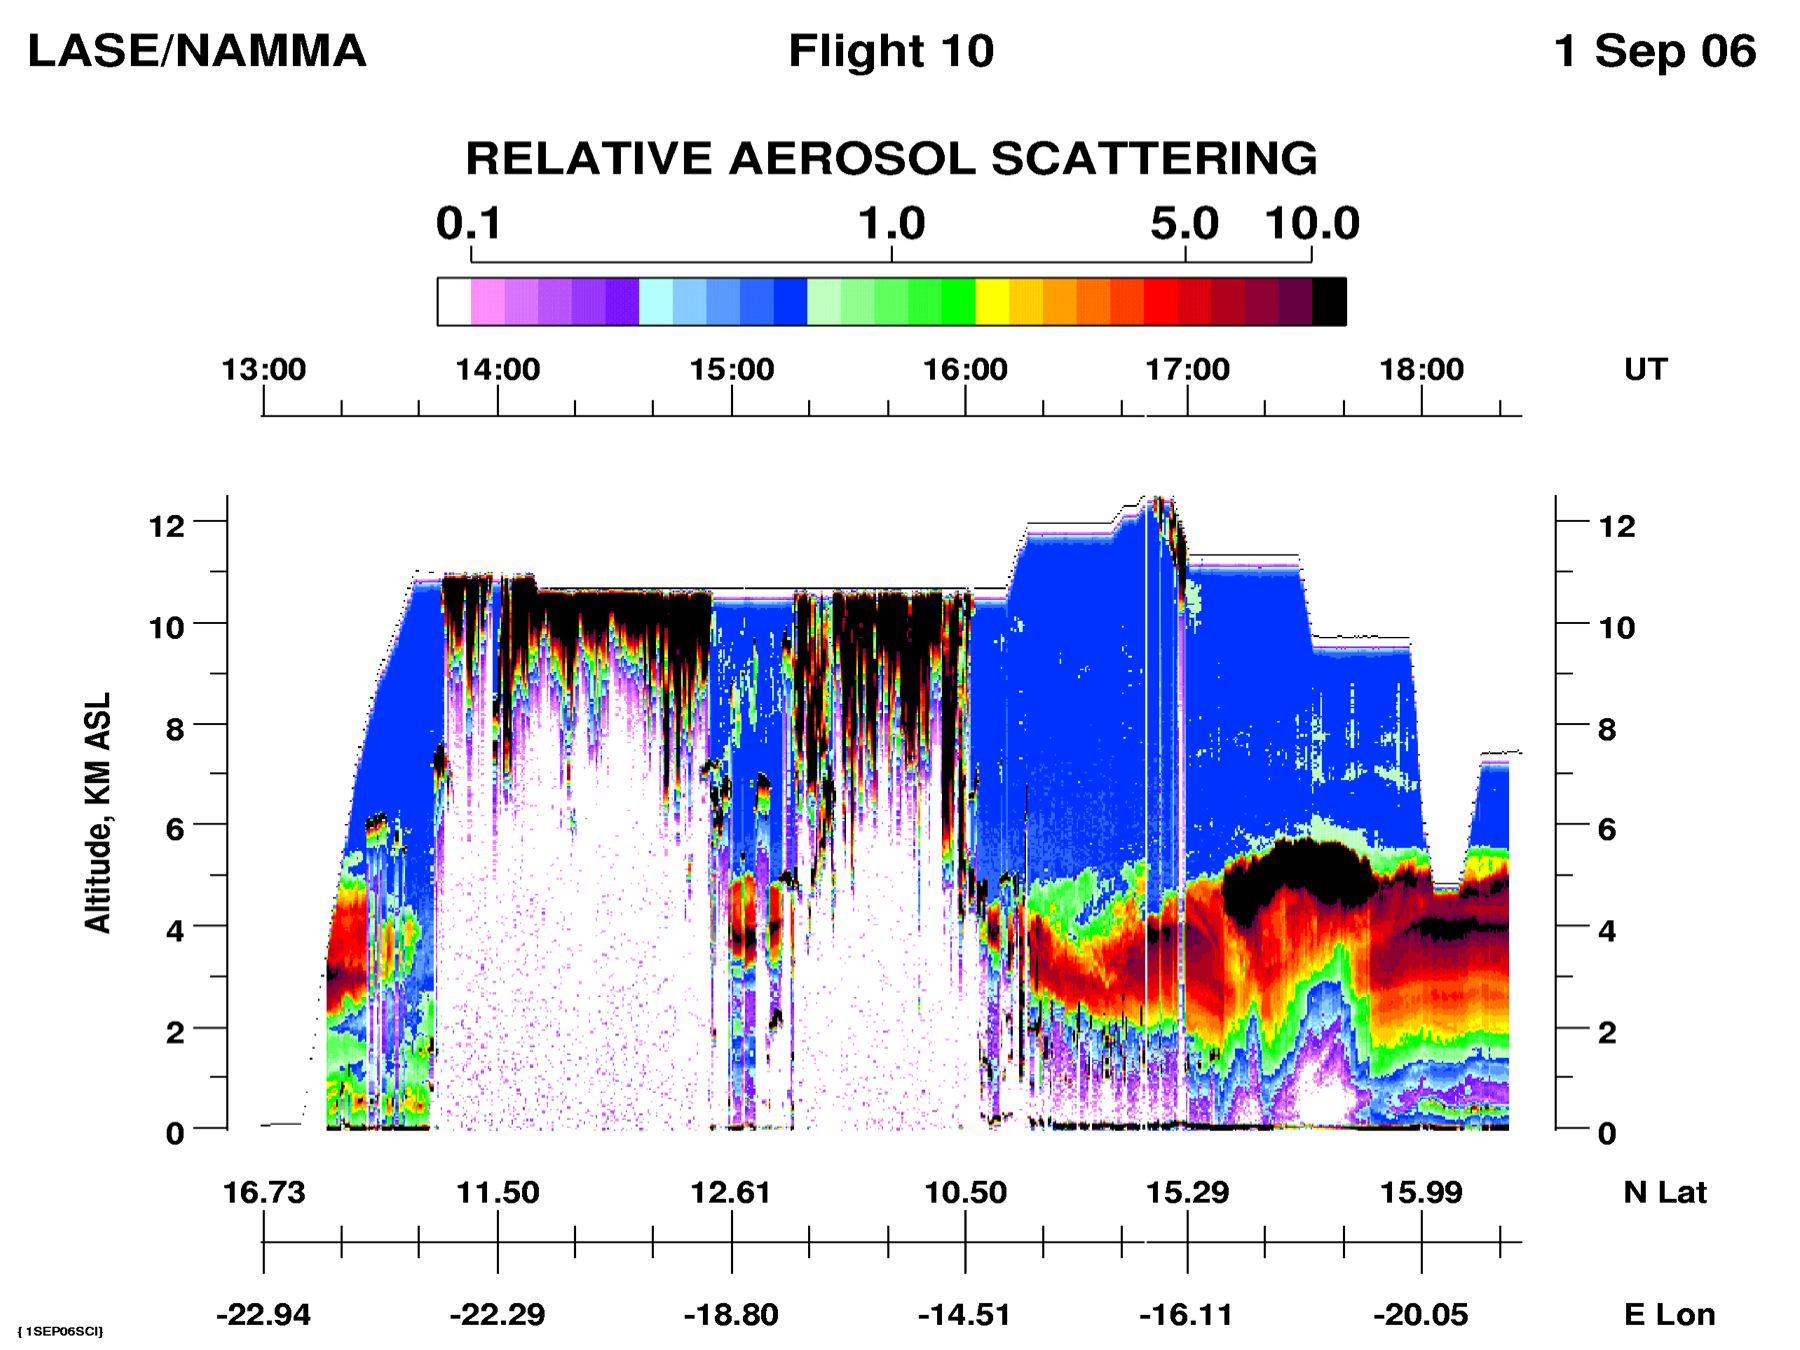
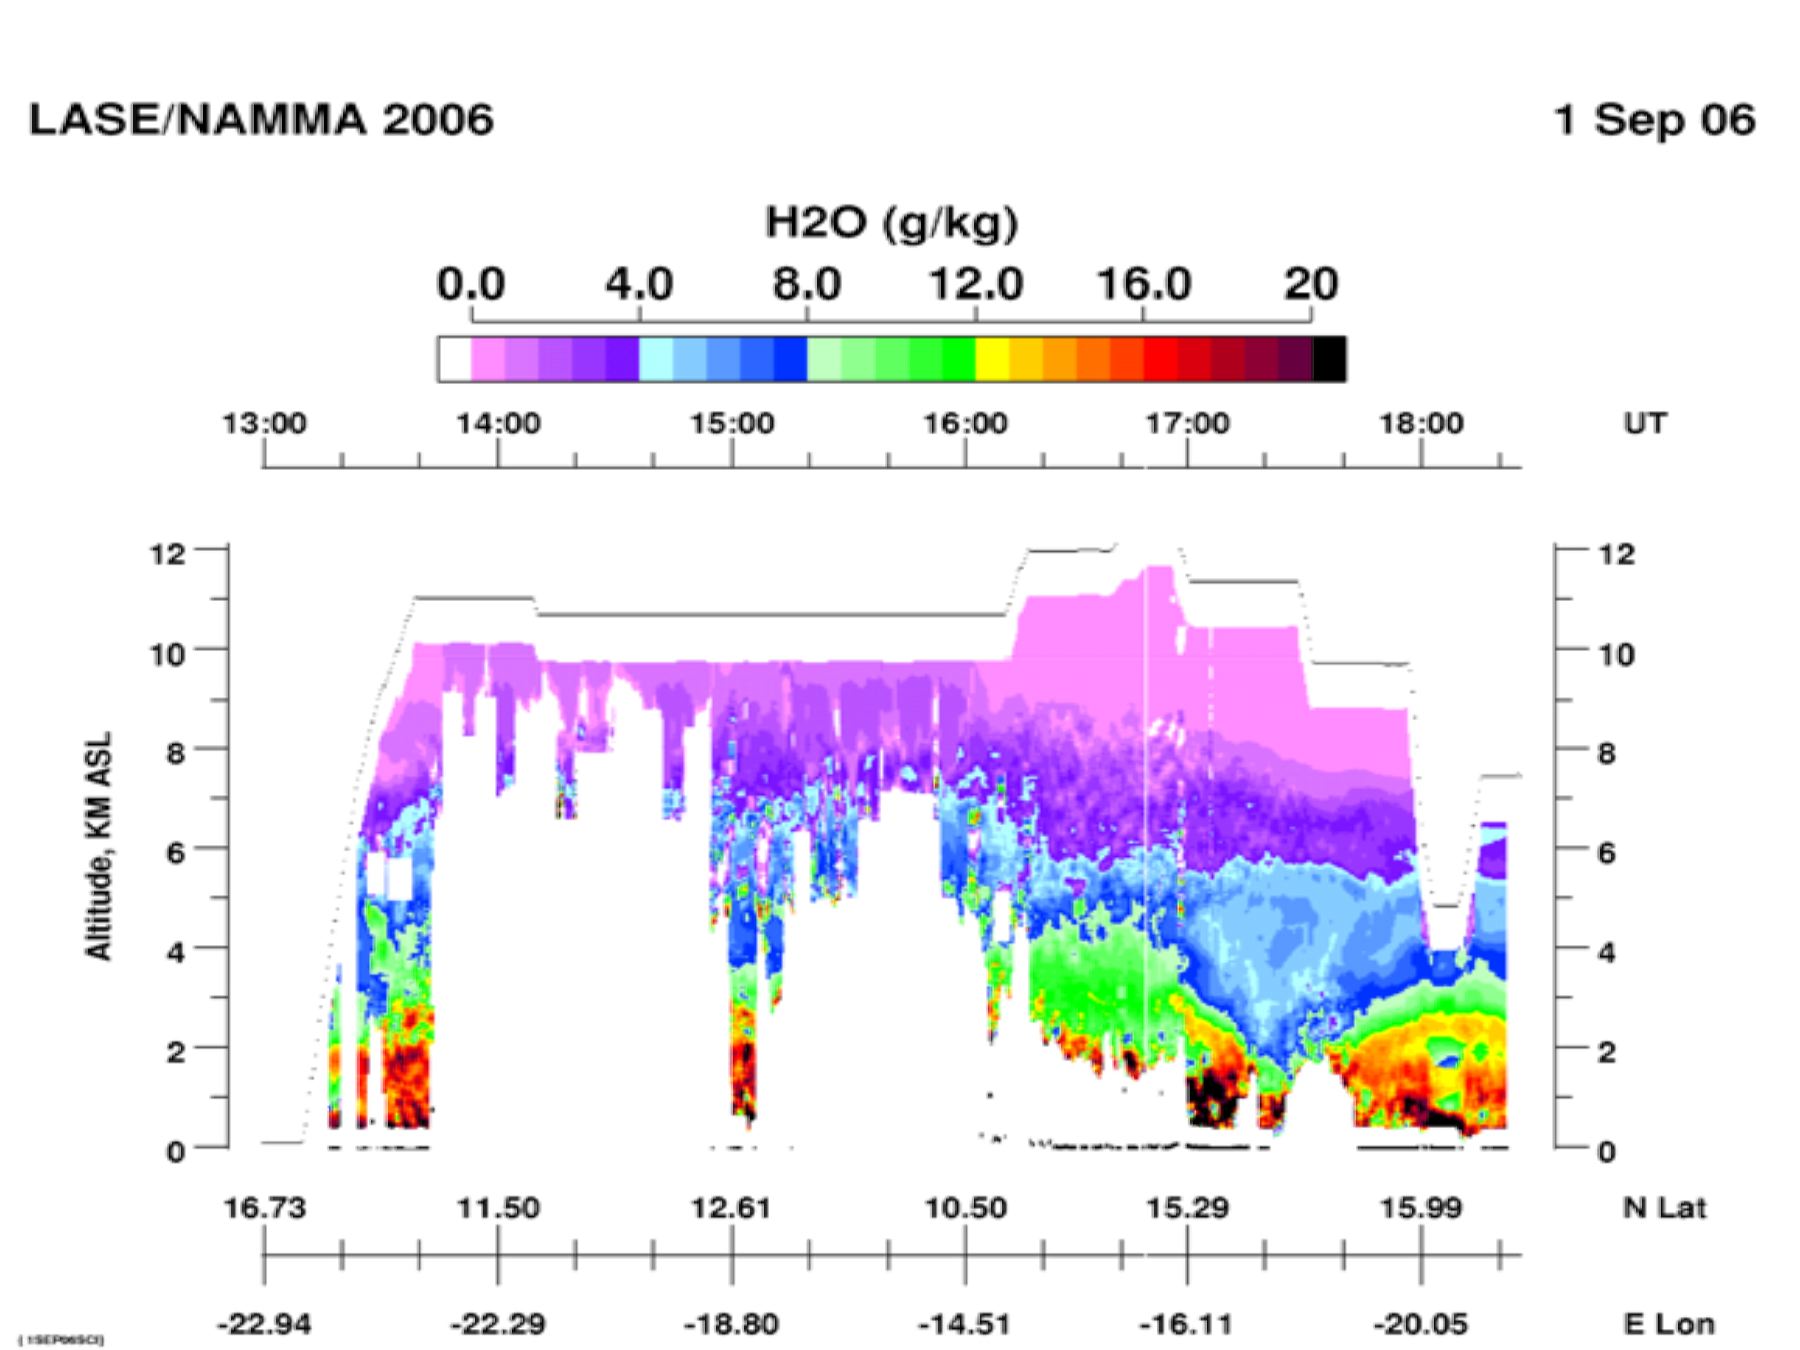
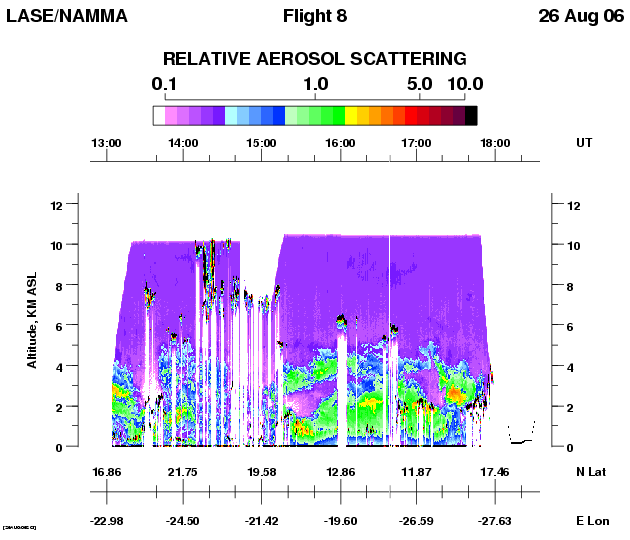
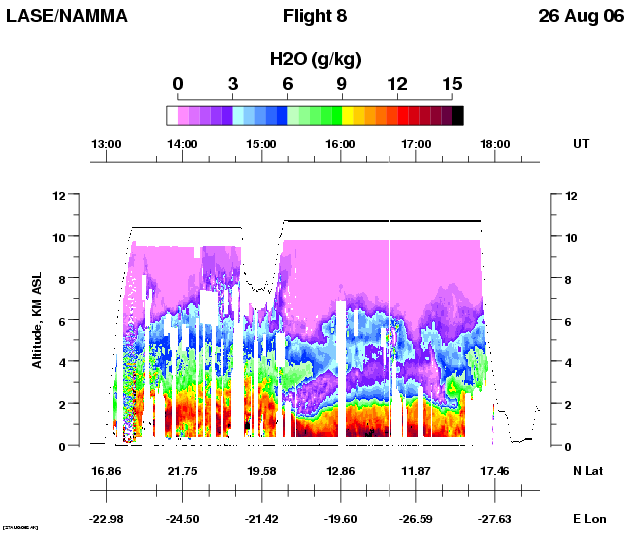
LASE had a great flight observing dust, water vapor, and cloud distributions on this combined cloud microphysical and dust sampling flight. On the south-east bound leg towards the cloud microphysics region near the ITCZ, LASE observed reasonable heavy dust loading near Sal in the 1-4 km altitude range, but the dust layer thinned out to a very light dust layer less than 700-m thick centered at 2.5 km. When we saw the first cloud, the dust layer ended. More on this later. At the same time as the dust layer was thinning, the moisture below 4 km was increasing, and interestingly, at the same time the marine boundary layer decreased in depth to ~700 m.

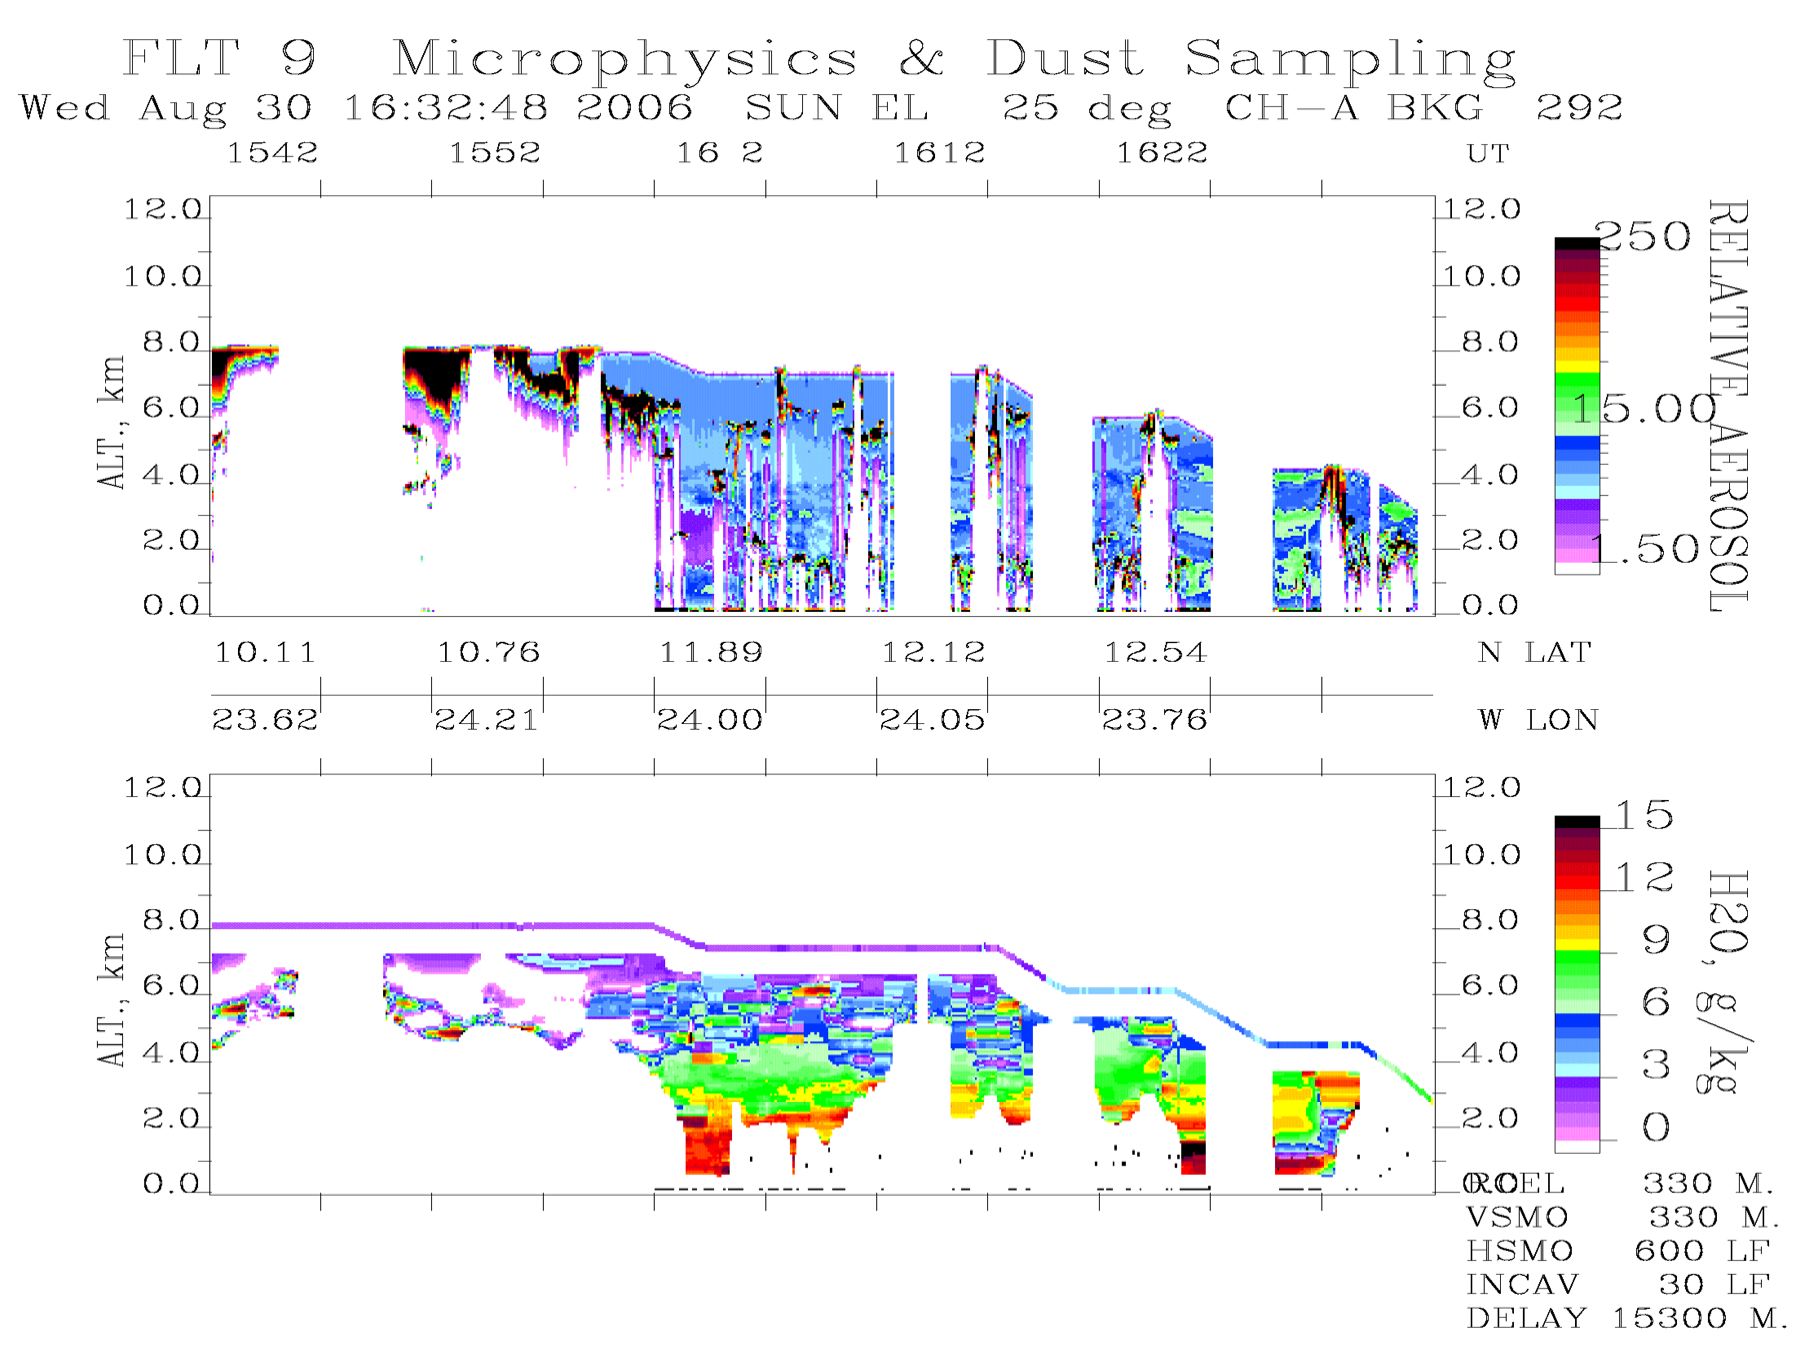
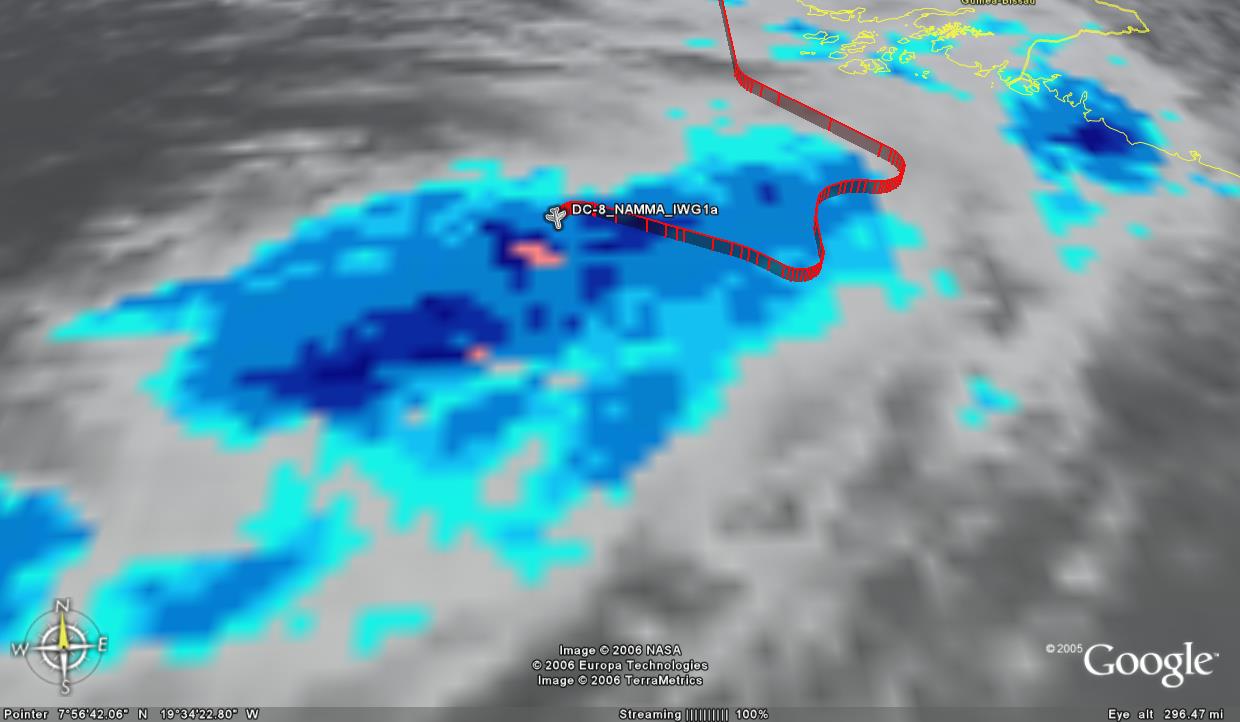
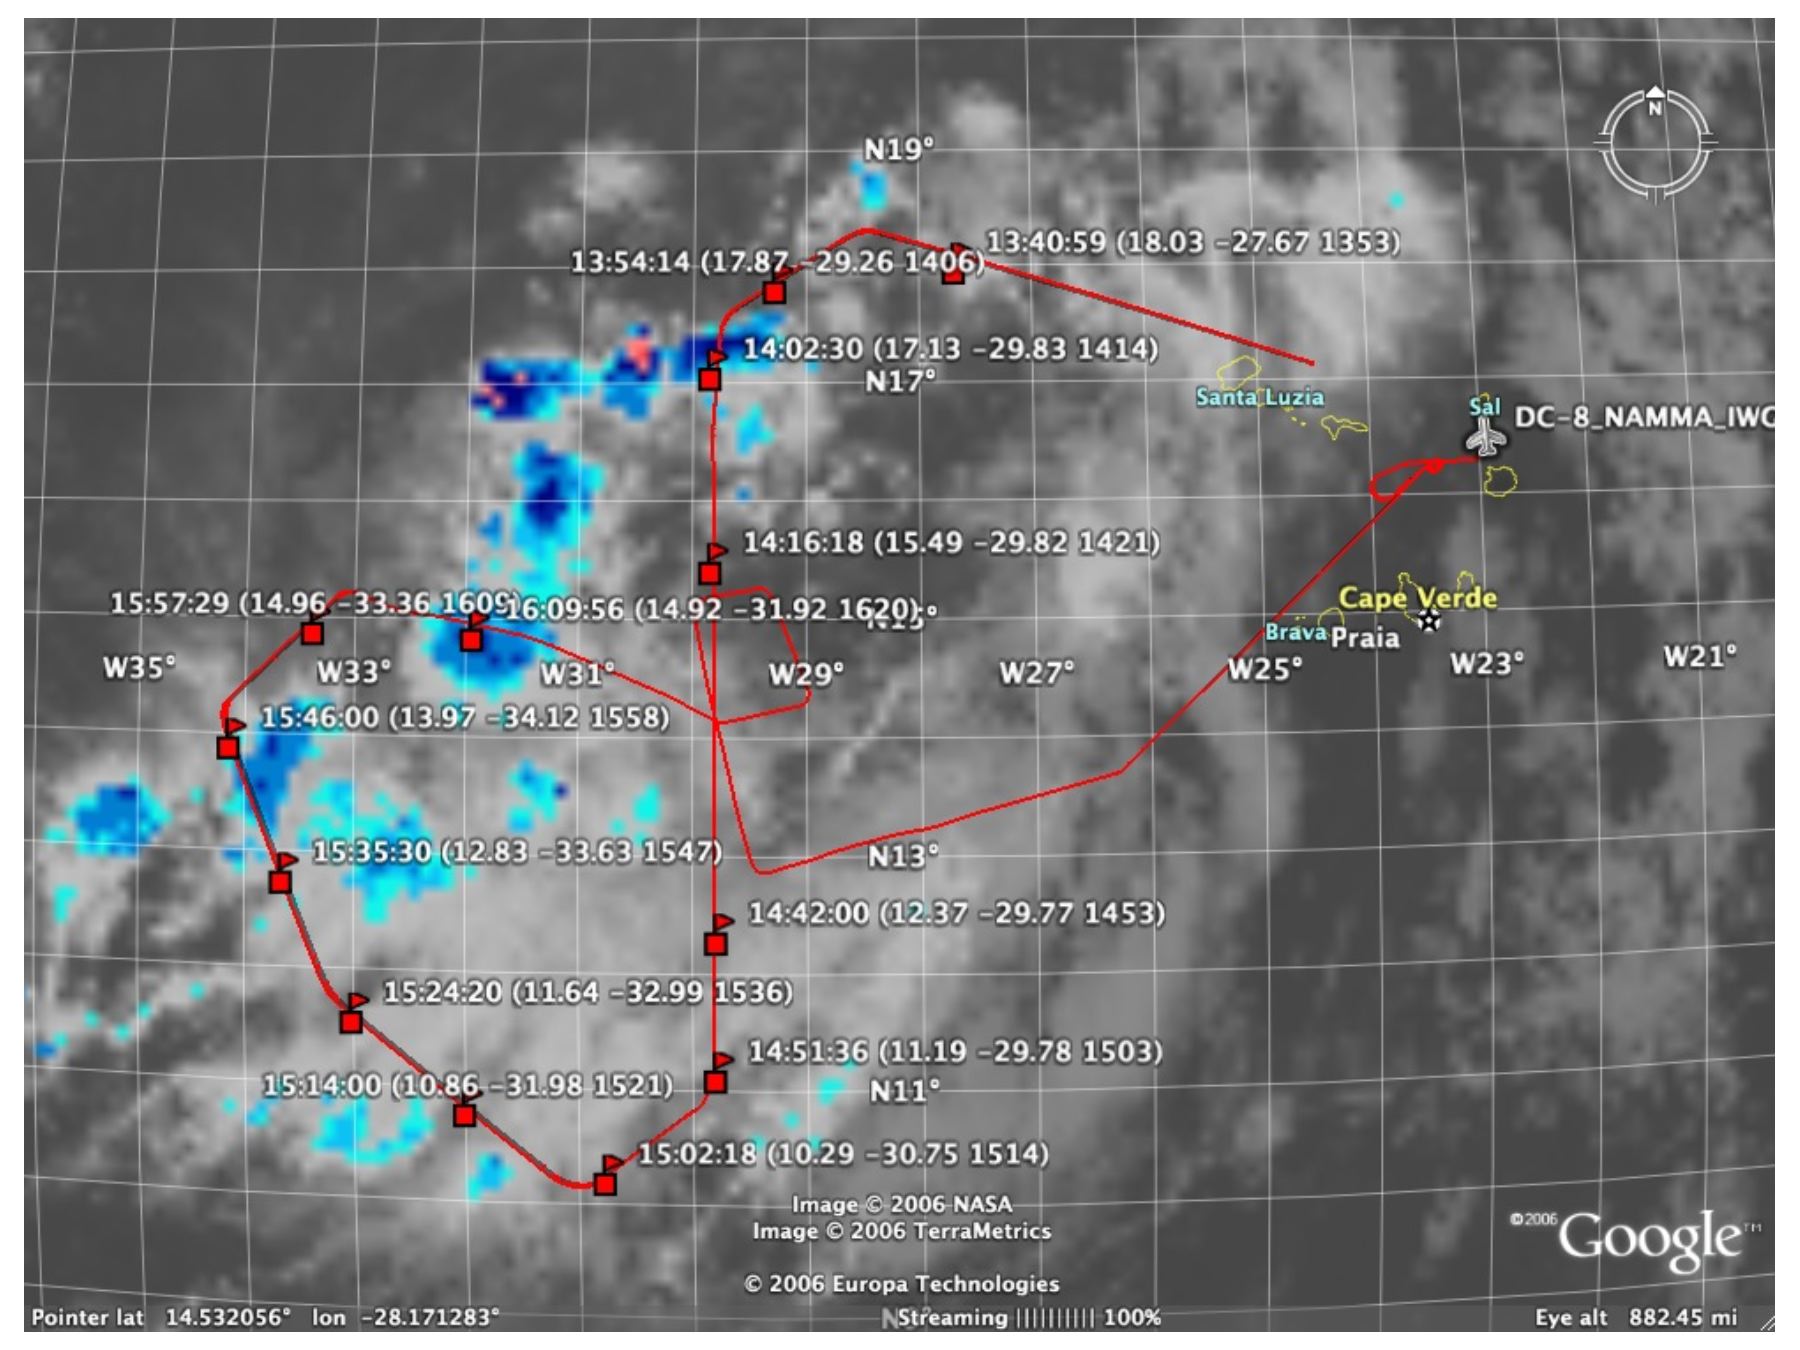
The cloud microphysics experiments were all done in clouds so there was no useful LASE data collected at that time. We went into a “clean cloud” sampling mode around 1600 UT, and what was interesting in that series of passes through a deep convective cloud was the observation by LASE showing the end of the dust layer on the north side of the cloud and clean conditions on the south side of the cloud. This was probably due to a convergence region where air with dust from north met clean air from the south, and convection developed at that location. This condition can be readily seen near 1622 UT.

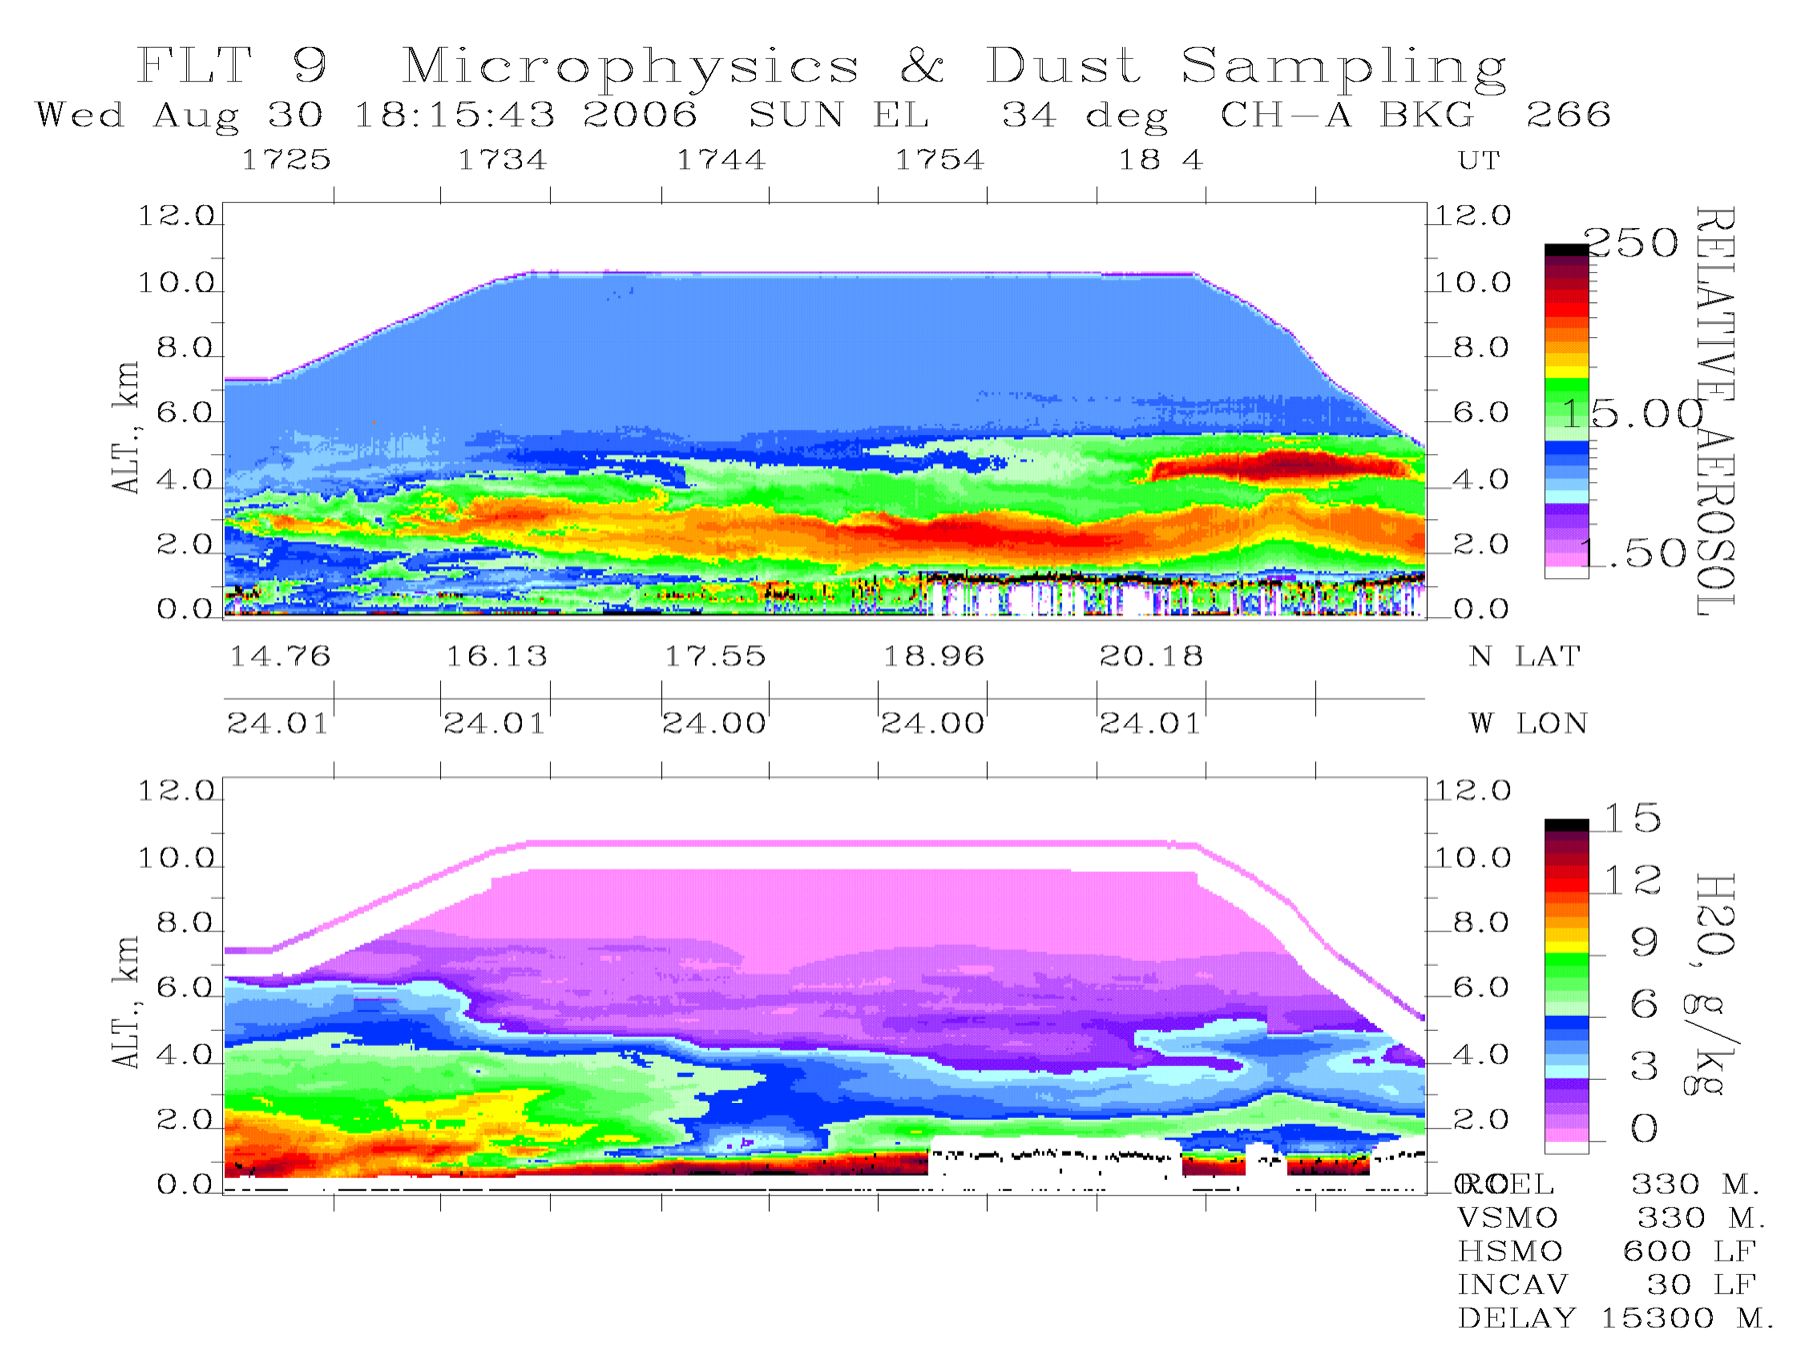
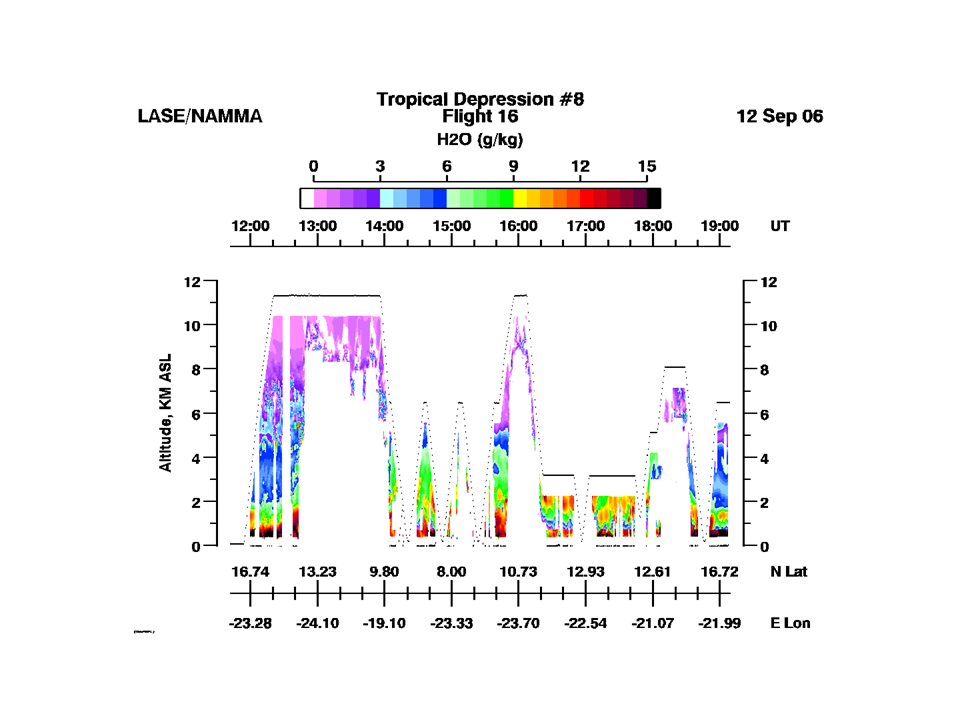
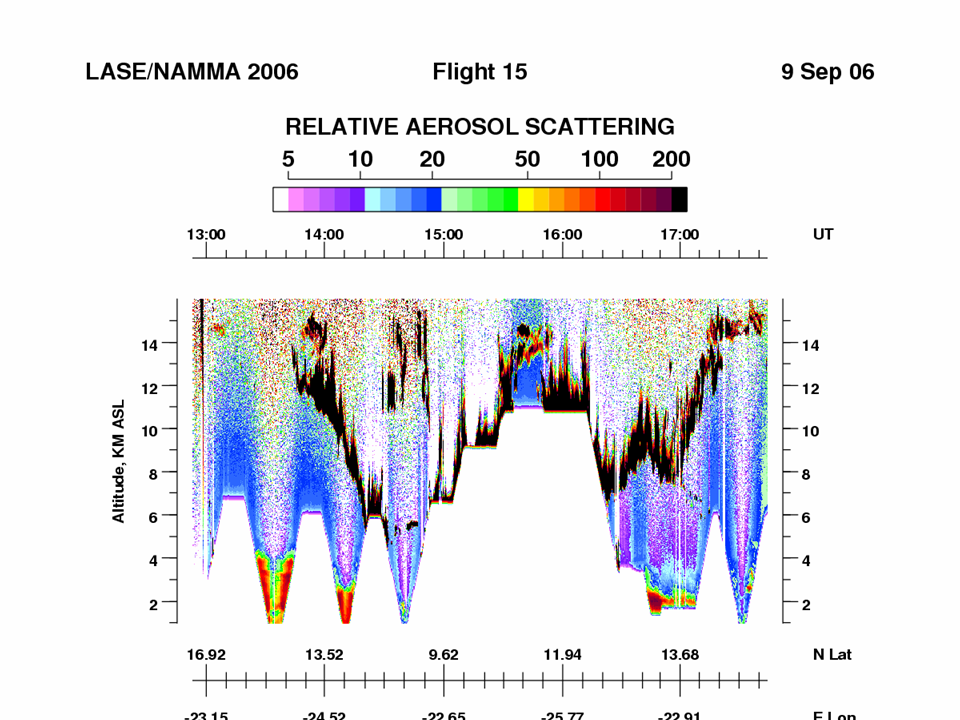
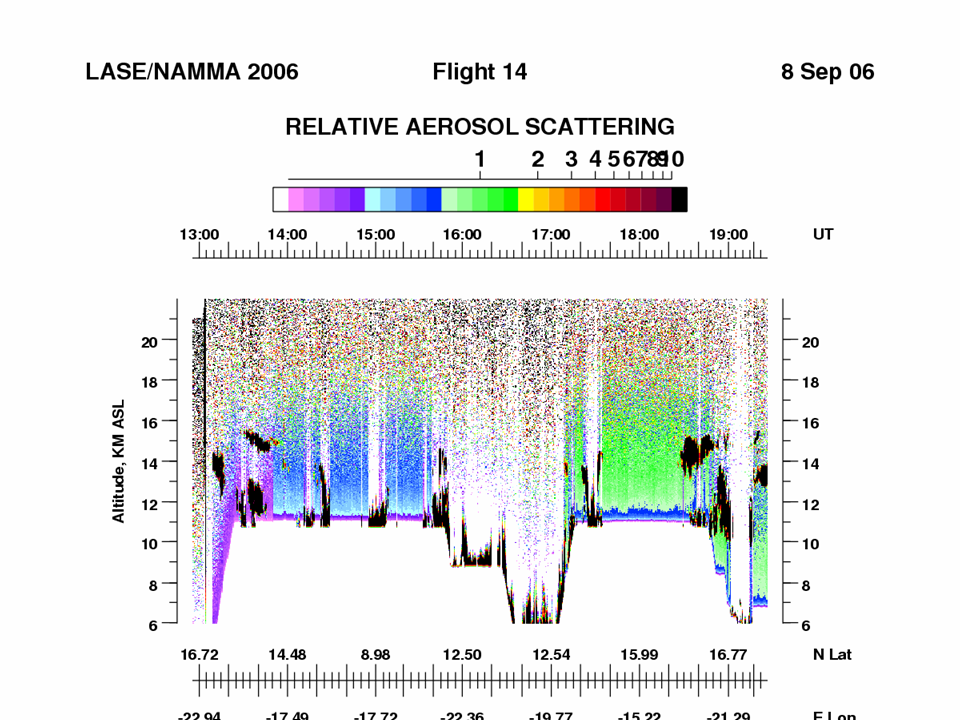
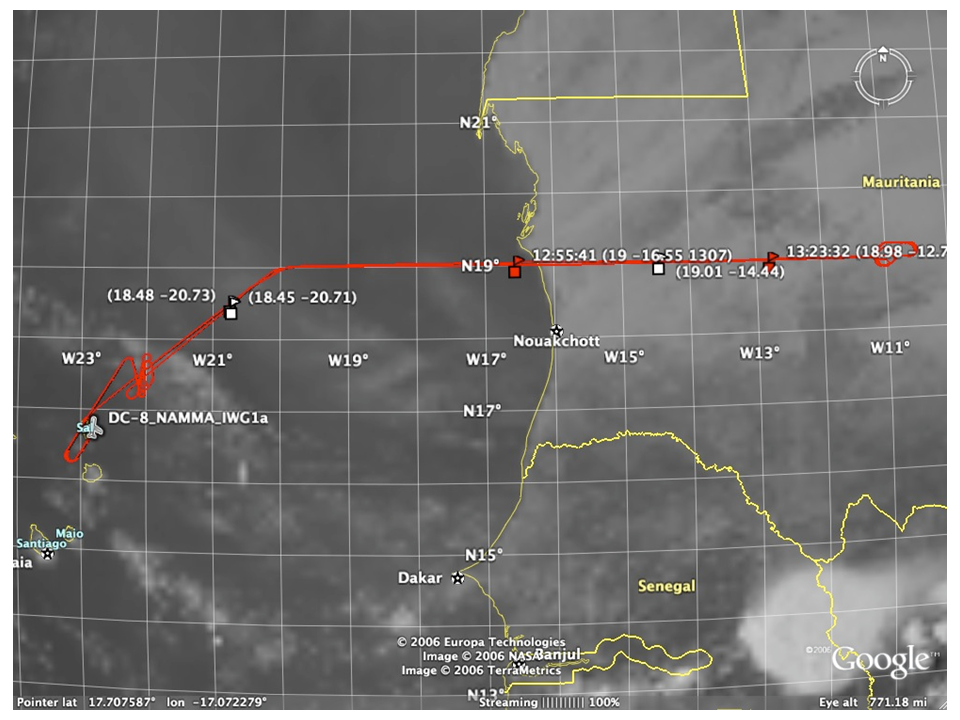
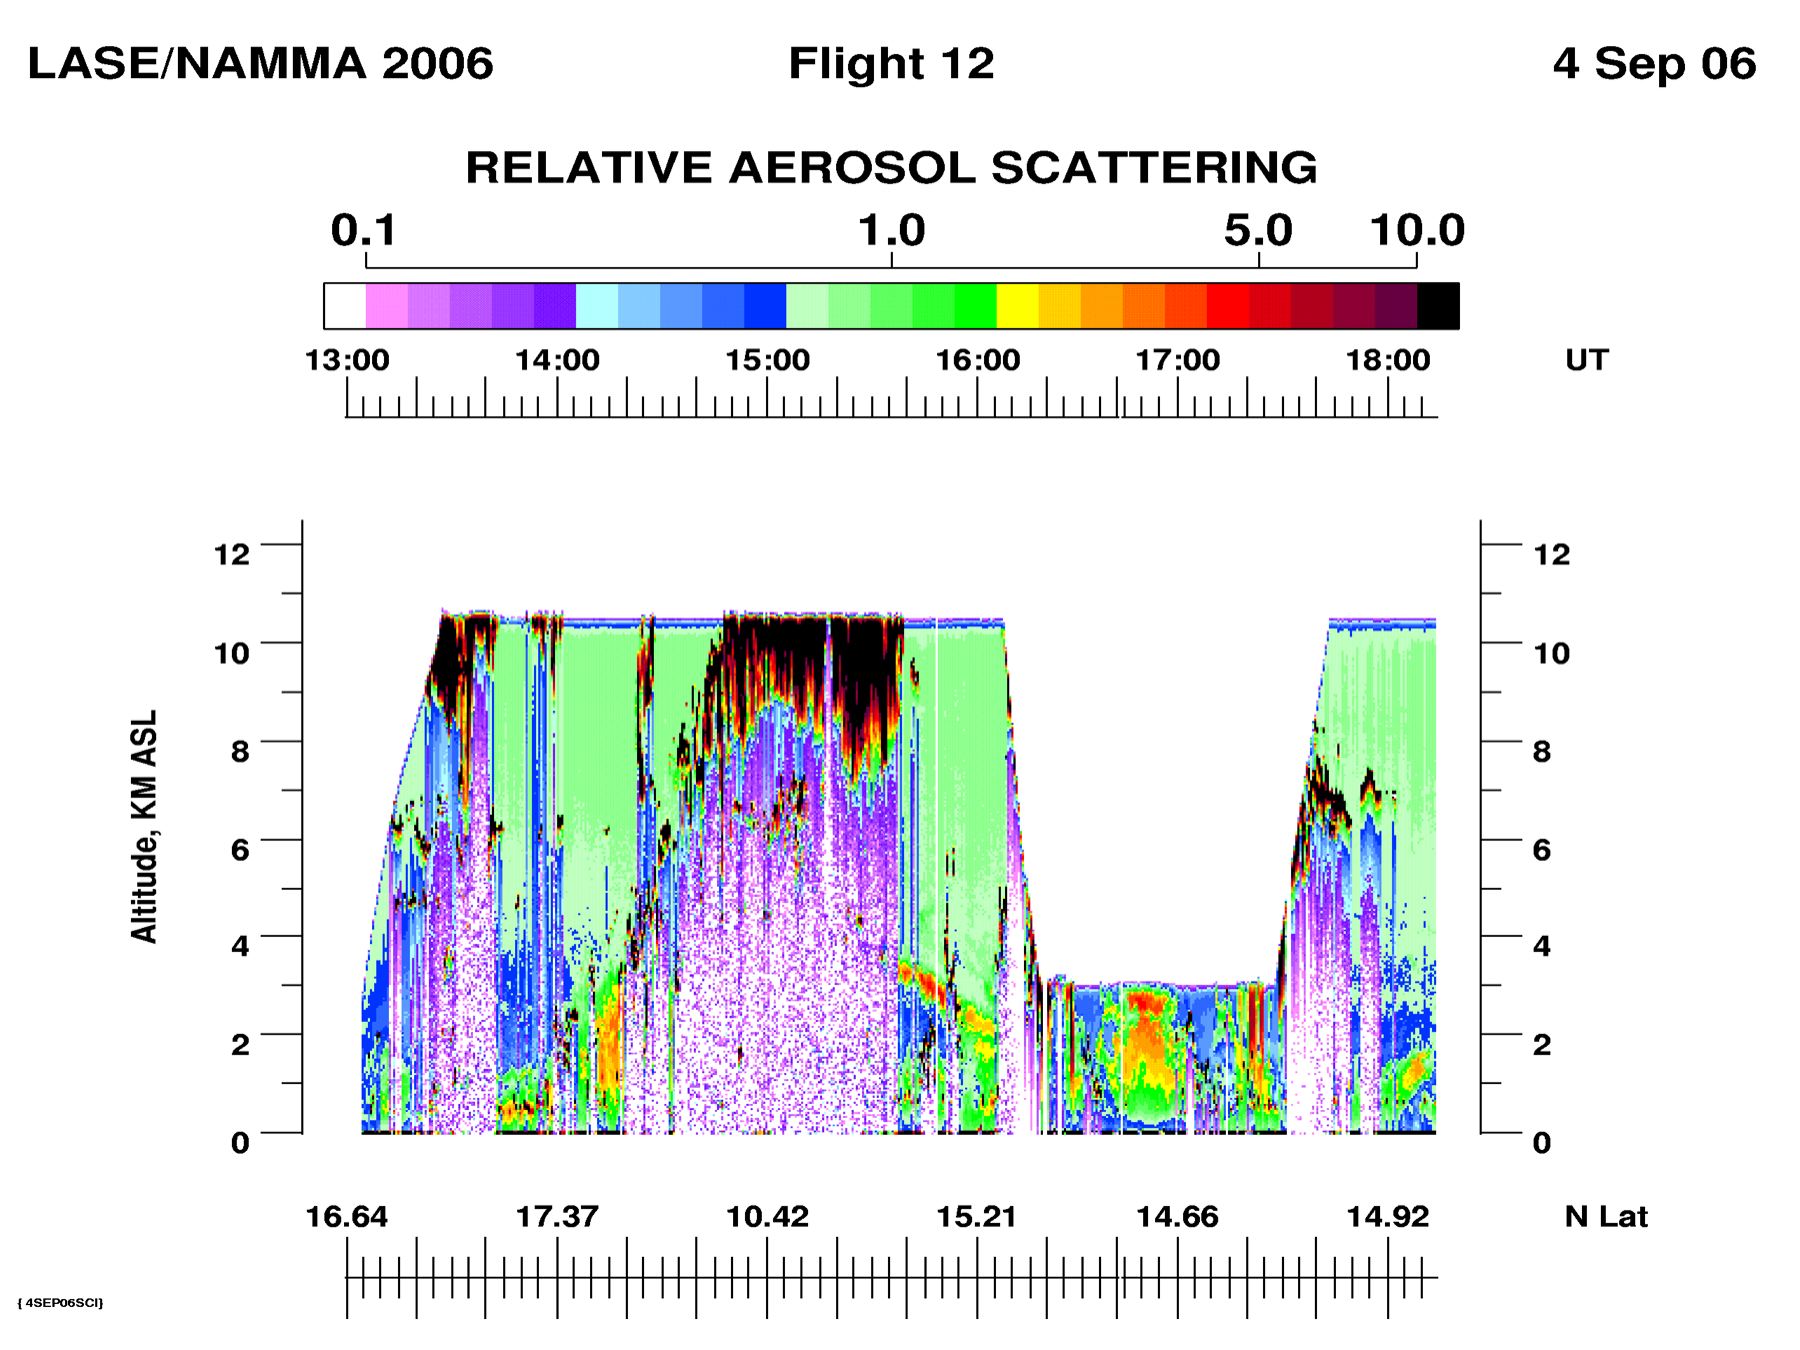
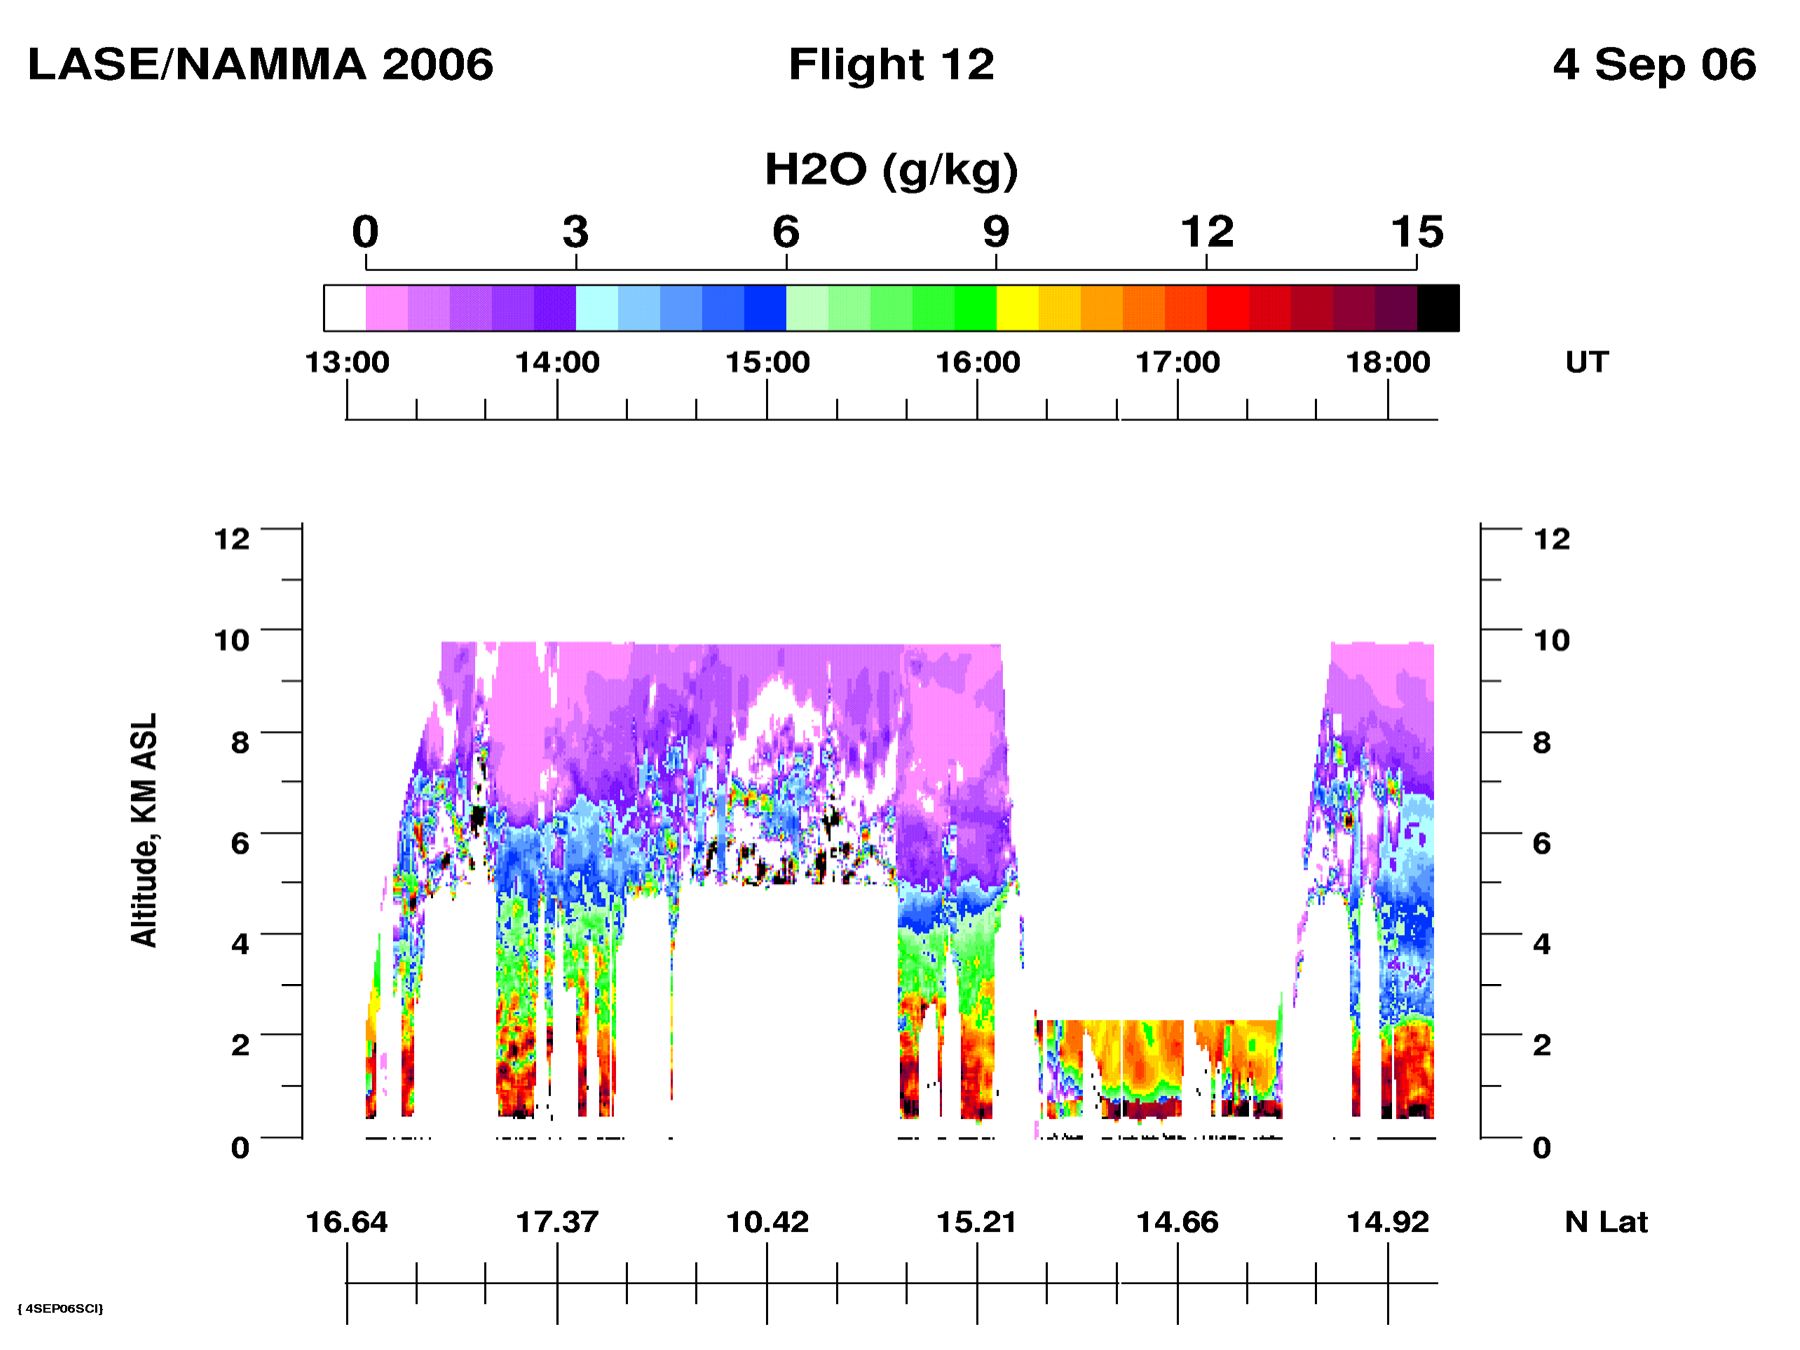
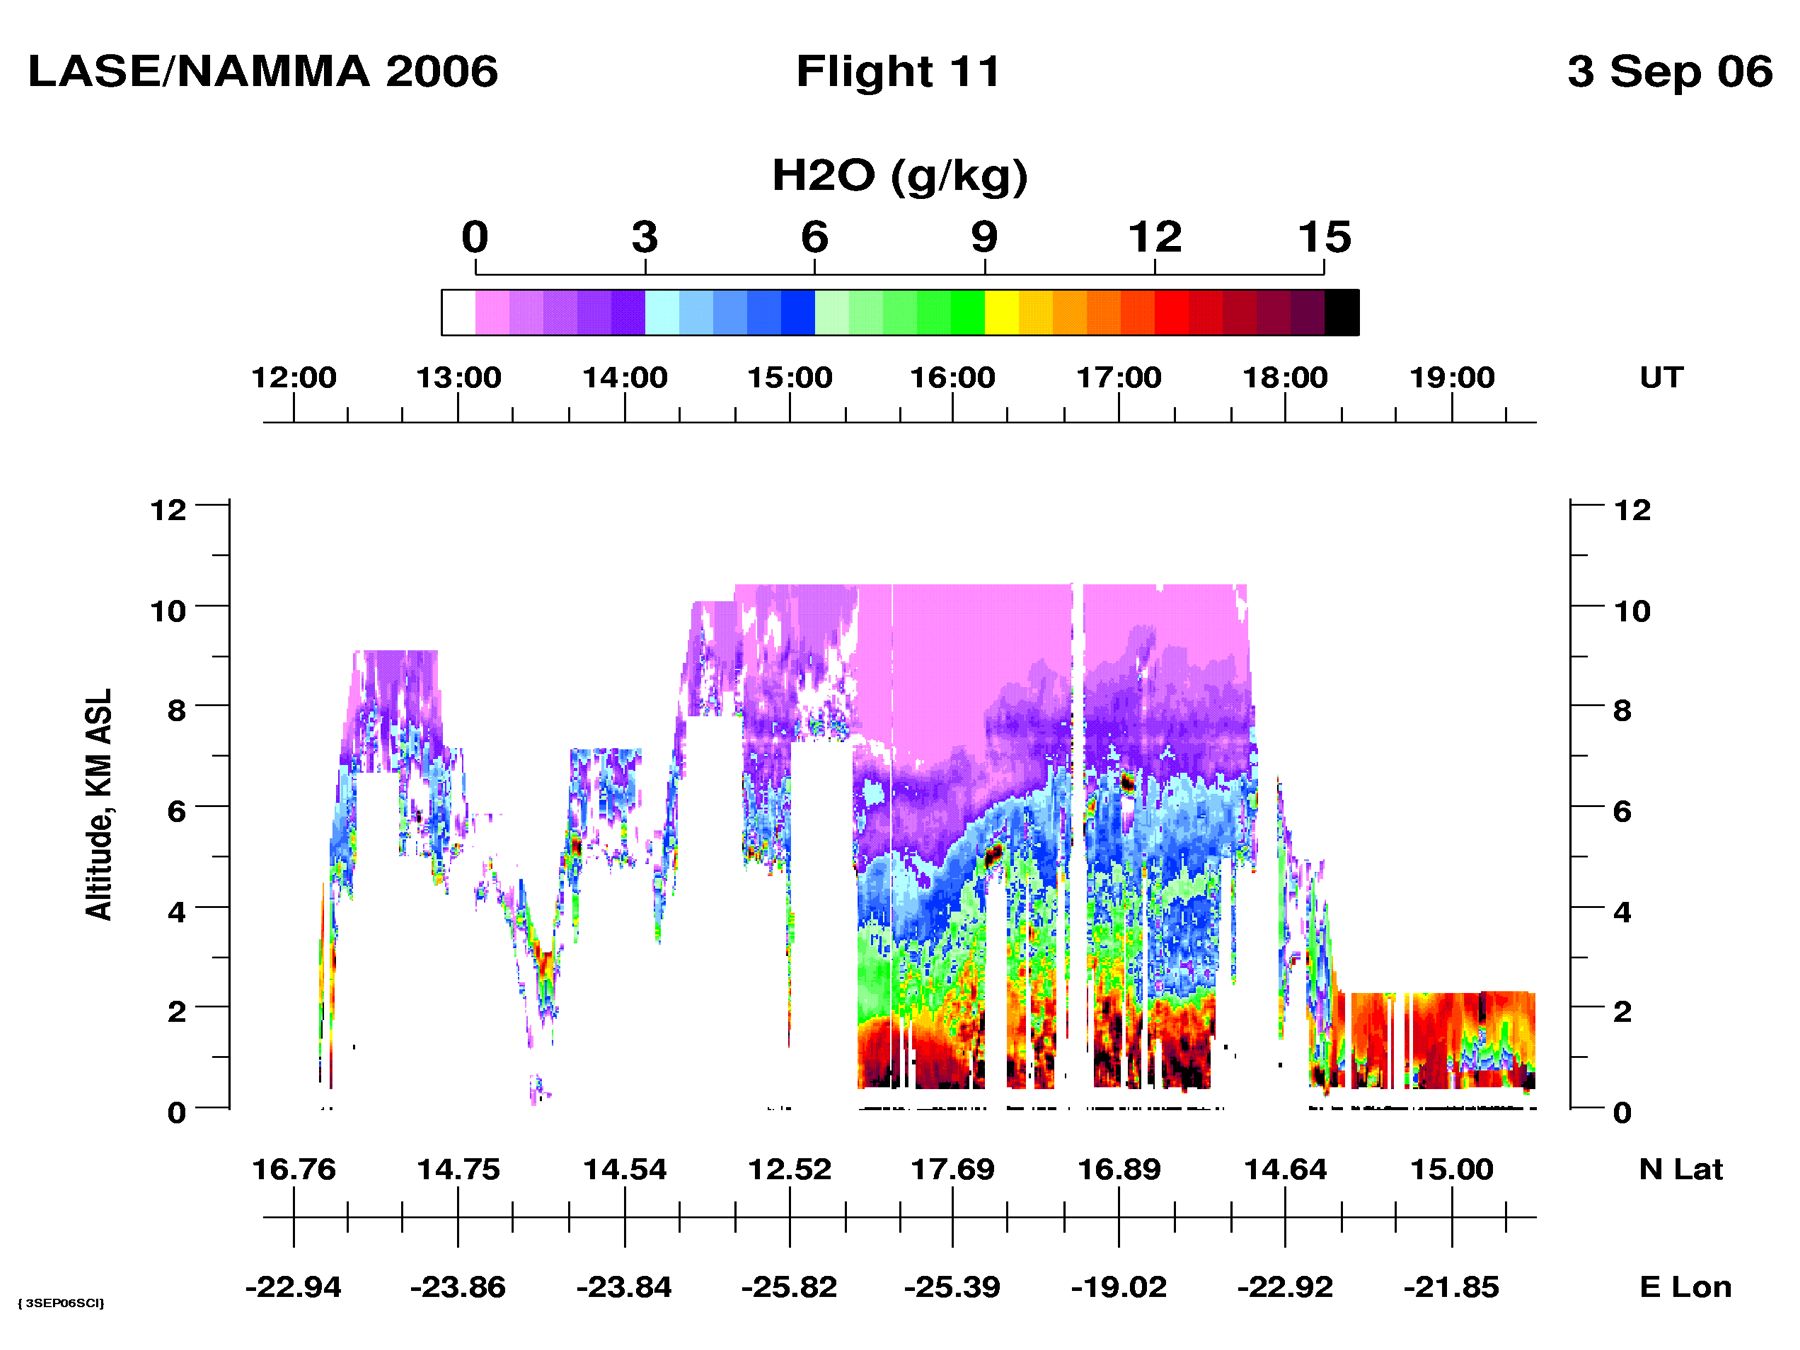
The last 3 hours of the flight was devoted to dust and “dirty cloud” sampling. We flew from about 12.5N to 20N at high altitude to get a cross section of the dust and moisture along 24W. The dust layer became heavier as we went north, and by 20N the layer extended from the top of the clouds at 1.5 km to 6 km. A second dust layer was observed centered at 4.5 km with the main layer centered at 2.5 km. The moisture distribution was also very interesting. The transition from a very deep moist lower troposphere south of 12N to very dry conditions at 20N. There were several inversions of the moisture profile observed at ~1738 UT and at 20N. At 20N the upper dust layer was dry with the moisture and dust negatively correlated across the entire layer. The lower dust layer was drier in the upper part of the layer and more moist near the surface, which was similar to other observed dust layers. We overflew past 20N by 2 minutes and then descended to spiraled down to 500 ft at 20N. A lot of good in situ measurements were made on that spiral. Once down near the surface we did “dirty cloud” sampling before going back up to 7500 ft for the south-bound leg at 24 20′W to sample the dust layer. The leg was offset to try to compensate for the drift in the dust layer. LASE only did zenith measurements on this leg.

Quicklooks:

Flgiht 9 image 1

Flight 9 - image 2

Flight 9 - image 3

Flight 9 - image 4

Flight 9 - image 5

LASE Science Flight 5 (Aug. 26) Easterly Wave

August 27th, 2006

Date of Flight: Aug. 26
Instrument Status: Green

Quicklook(s):

NAM08N_H2O_ALL_lin1.png

NAM08N_RSQ_ALL1.png


Instrument Performance: Instrument worked well during the flight.

Science Observations:

LASE measured water vapor mixing ratio and aerosol scattering around the Easterly Wave.  Around the northern part of the track, dust amounts were relatively low. The dust was scattered throughout much of the layer between the surface and 4 km.  Compared to the southeastern and southern parts of the track, water vapor amounts were higher.  LASE collected data during the portions of a CALIPSO/CLOUDSAT track where the DC-8 was not in clouds. This portion of the track included an elevated dust layer.  Conditions were very dry and relatively dust free in the southeastern and southern parts of the track.  More dust was observed on the western portion of the track.

LASE Science Flight 4 (Aug. 25) Dust Intercomparison and Wave

August 26th, 2006

Date of Flight: Aug. 25
Instrument Status: Green

Quicklook(s):

NAM07N_RSQ_ALL3.png

NAM07N_H2O_ALL1_lin.png
Instrument Performance: Instrument worked well during the flight.

Science Observations:

LASE measurements were used to direct DC-8 and UK Bae146 to proper altitudes for dust sampling east of Sal.  Maximum dust was observed between 2.1 to 3 km and extended to abot 4 km. Considerable dust variability was observed during the comparison run.  LASE also tracked water vapor and aerosols just north of wave along Africa coast and saw high water vapor just north of ITCZ.  Water vapor amounts decreased to the north of this area near Sal. Dust amounts also increased near Sal relative to north of ITCZ.

Have you used our data? Register for updates