
22 Sept 2010 DC-8 Platform Scientist Report (PGI-46) - Ed Zipser
DC-8 Platform Scientist Report Sept 22, 2010
Takeoff STX 160047 UTC; landing FLL 233705 UTC.
This was a successful flight for the main purpose of obtaining a second consecutive day of coverage of PGI-46, estimated center at 18Z near 13 N 70-71 W. Also for the second consecutive day, the DC-8 followed the G-V (in time), collectively providing dense dropsonde and other data coverage in this weather system.
The plan was simple before takeoff, but we decided to modify it to include a second consecutive day of a CloudSat underflight. So with great assistance (and patience) from our navigator, we designed a modified flight plan to cover the eastern portion of the pattern before the overpass at 1810 UTC, and the remainder of the pattern later. In the end, we obtained dropsonde coverage over the entire intended domain, westward from the Venezuela FIR boundary (could not enter that) near 68 W, to 74 W, and from 12.5 N to 15.5 N. In addition, we made some minor modifications of the track to make some drops in portions of the pattern where the G-V reported failure of a few drops in important locations. This simply reinforces the great value of good communications between scientists in aircraft and on the ground with tools like RTMM and XChat. The DC-8 also had signal problems with some sondes, especially in the early part of the flight, in or near intense convection and heavy rain in the southeast portion of the pattern.
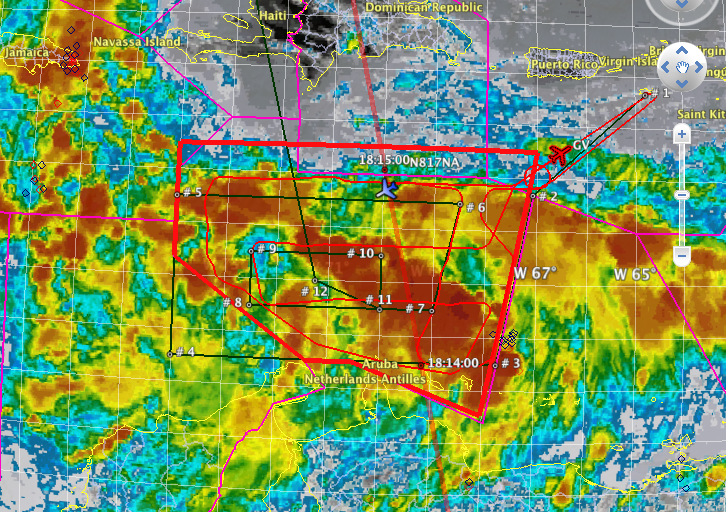
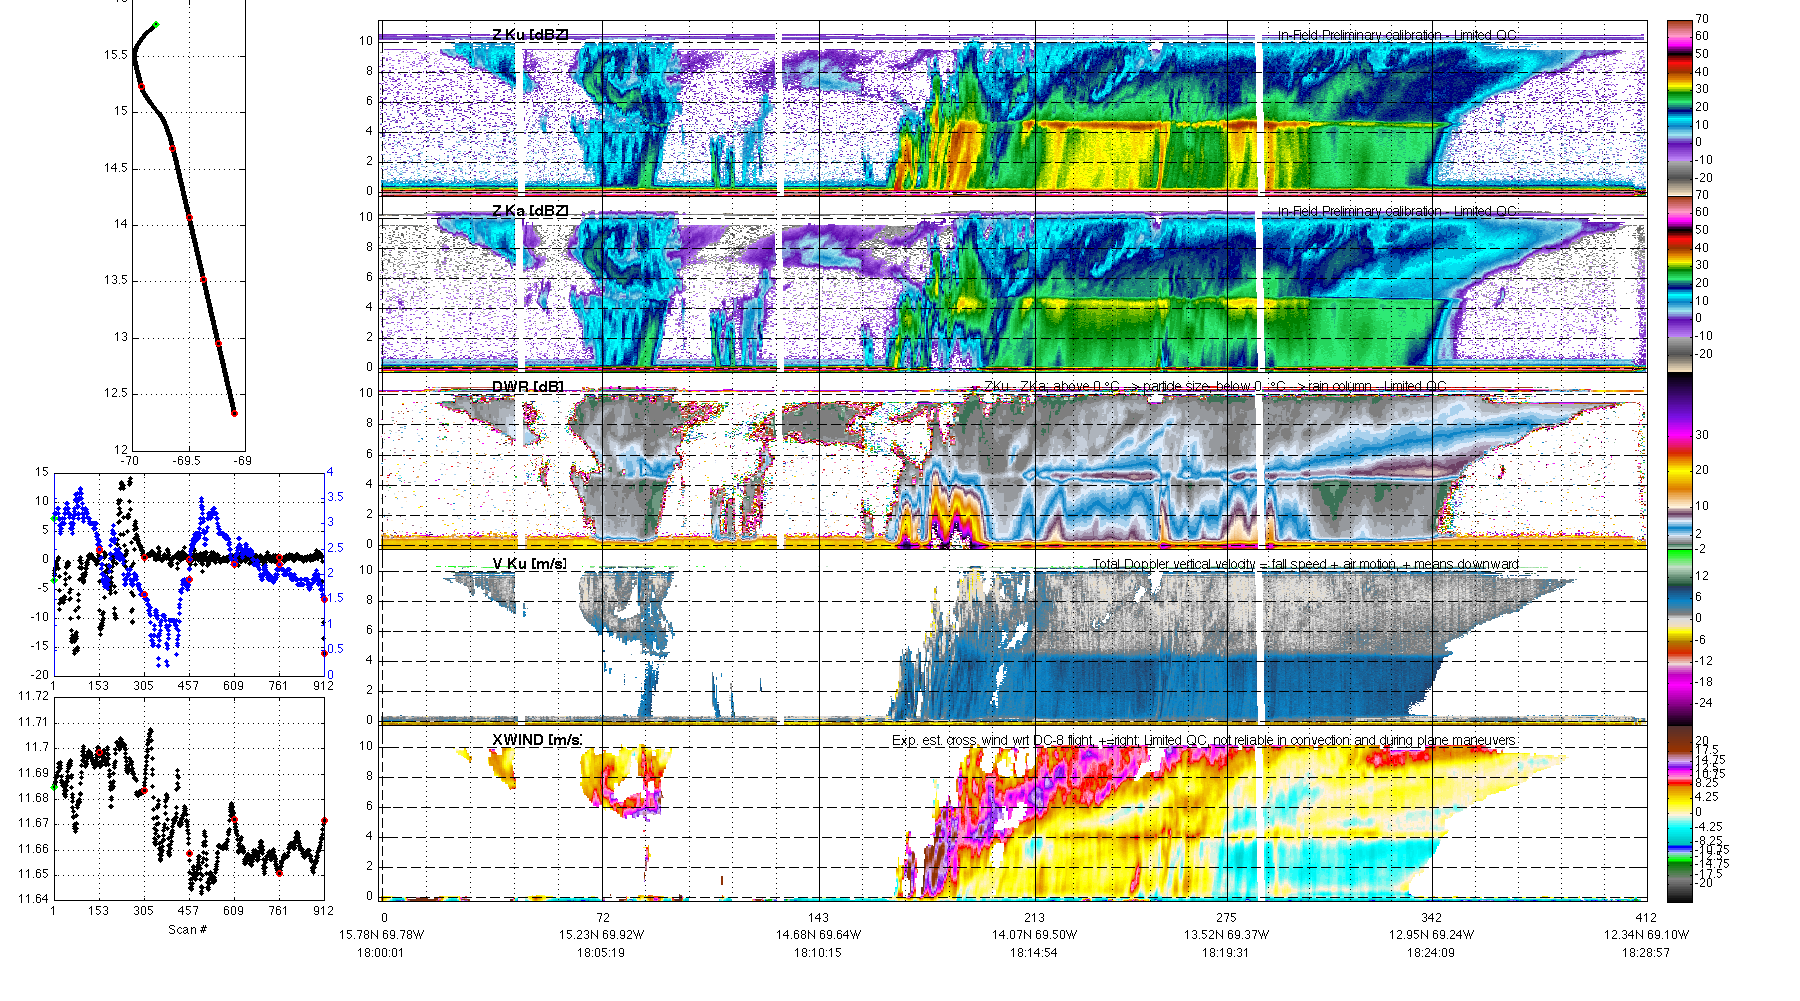
The attached images show the overall cloud and precipitation structure of the system, covering a large area with cold cloud, but with the heaviest convection covering an arc-shaped region on both satellite and the Curacao radar. This convection was strongest during the G-V penetration with strong turbulence near the DC-8 waypoint 7 (13.5; 69), and weakened with time, such that the DC-8 encountered mostly stratiform precipitation near that location during the Cloudsat underflight (see figure from APR2) and later.
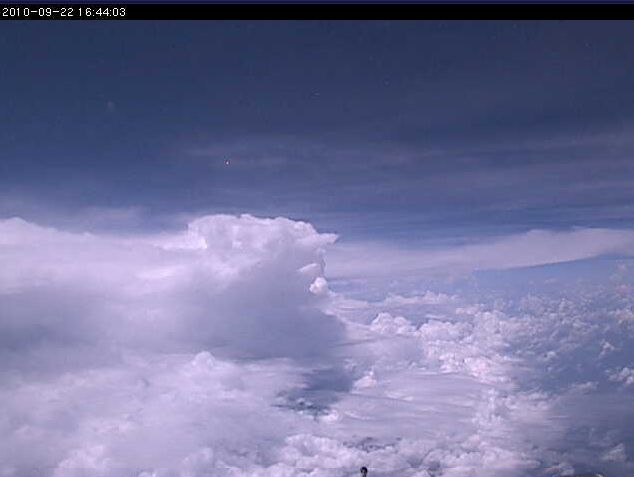
The cloud image is from the forward camera at 1647 UTC looking westward from near 16 N 68 W, showing strong convection just north of the main area of high cold clouds on the IR.
The dropsonde pattern, when quick-look analysis is complete, should show a stronger vorticity center than on the previous day, with the only clear evidence of westerly wind components (on both drops and cross-wind component from APR-2 - see that image) being above the surface layers, perhaps between 2-4 km altitude.
| Attachment | Size |
|---|---|
| Sep22_DC8_PlatformSci_report.docx | 127.3 KB |
| DC8_IR_GVleaving_1800Z.png | 815.71 KB |
| N_edge of WX_1647Z.png | 178.46 KB |
| cur.17Z.gif | 54.3 KB |
| APR2_AT_100922_1800Z-1829Z_Y_0_C-1-4-7-3-10.png | 612.13 KB |
